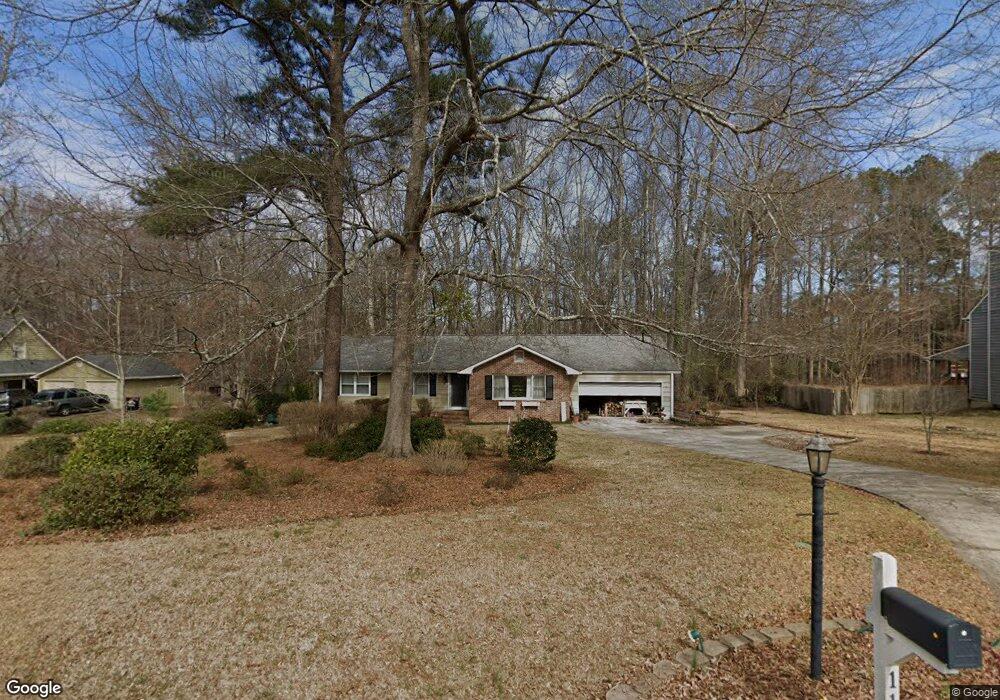
119 Cumberland Rd Griffin, GA 30224
Spalding County NeighborhoodEstimated Value: $241,598 - $326,000
3
Beds
2
Baths
1,664
Sq Ft
$166/Sq Ft
Est. Value
About This Home
This home is located at 119 Cumberland Rd, Griffin, GA 30224 and is currently estimated at $276,900, approximately $166 per square foot. 119 Cumberland Rd is a home located in Spalding County with nearby schools including Crescent Road Elementary School, Rehoboth Road Middle School, and Spalding High School.
Ownership History
Date
Name
Owned For
Owner Type
Purchase Details
Closed on
Sep 16, 2011
Sold by
Clement Geoffrey F
Bought by
Clement Geoffrey F and Clement Sarah F
Current Estimated Value
Home Financials for this Owner
Home Financials are based on the most recent Mortgage that was taken out on this home.
Original Mortgage
$89,300
Outstanding Balance
$61,094
Interest Rate
4.24%
Mortgage Type
New Conventional
Estimated Equity
$215,806
Purchase Details
Closed on
Dec 27, 2010
Sold by
Federal Natl Mtg Assn Fnma
Bought by
Flake Cary R
Purchase Details
Closed on
Jul 6, 2010
Sold by
Wells Fargo Bk Na
Bought by
Federal Natl Mtg Assn Fnma
Purchase Details
Closed on
Dec 15, 1993
Sold by
Welch A Thomas Athene H
Bought by
Horn Jack V Eula L
Purchase Details
Closed on
Jul 11, 1992
Sold by
Simmons Wayne Robert and Robin Lee
Bought by
Welch Welch A and Welch Athene H
Purchase Details
Closed on
Jul 31, 1987
Sold by
Carlisle John R
Bought by
Simmons Wayne Robert and Robin Lee
Create a Home Valuation Report for This Property
The Home Valuation Report is an in-depth analysis detailing your home's value as well as a comparison with similar homes in the area
Home Values in the Area
Average Home Value in this Area
Purchase History
| Date | Buyer | Sale Price | Title Company |
|---|---|---|---|
| Clement Geoffrey F | -- | -- | |
| Clement Geoffrey F | $94,000 | -- | |
| Flake Cary R | -- | -- | |
| Federal Natl Mtg Assn Fnma | -- | -- | |
| Wells Fargo Bk Na | $106,373 | -- | |
| Horn Jack V Eula L | $89,000 | -- | |
| Welch Welch A | $79,900 | -- | |
| Simmons Wayne Robert | $73,500 | -- |
Source: Public Records
Mortgage History
| Date | Status | Borrower | Loan Amount |
|---|---|---|---|
| Open | Clement Geoffrey F | $89,300 | |
| Closed | Clement Geoffrey F | $89,300 | |
| Closed | Horn Jack V Eula L | -- |
Source: Public Records
Tax History Compared to Growth
Tax History
| Year | Tax Paid | Tax Assessment Tax Assessment Total Assessment is a certain percentage of the fair market value that is determined by local assessors to be the total taxable value of land and additions on the property. | Land | Improvement |
|---|---|---|---|---|
| 2024 | $2,522 | $72,315 | $11,200 | $61,115 |
| 2023 | $2,522 | $72,315 | $11,200 | $61,115 |
| 2022 | $1,801 | $51,336 | $10,000 | $41,336 |
| 2021 | $1,589 | $45,503 | $10,000 | $35,503 |
| 2020 | $1,365 | $39,200 | $10,000 | $29,200 |
| 2019 | $1,392 | $39,200 | $10,000 | $29,200 |
| 2018 | $1,413 | $38,779 | $10,000 | $28,779 |
| 2017 | $1,374 | $38,779 | $10,000 | $28,779 |
| 2016 | $1,280 | $35,648 | $10,000 | $25,648 |
| 2015 | $1,320 | $35,648 | $10,000 | $25,648 |
| 2014 | $1,346 | $35,648 | $10,000 | $25,648 |
Source: Public Records
Map
Nearby Homes
- 174 Grange Rd
- 3000 Ext S 6th St
- 2002 Millstream Ct
- 2000 Millstream Ct
- 1011 Waverly Dr
- 1013 Waverly Dr
- LOT 48 Waverly Dr Unit 1
- LOT 47 Waverly Dr Unit 1
- LOT 69 Waverly Dr Unit 1
- LOT 68 Waverly Dr Unit 1
- LOT 67 Waverly Dr Unit 1
- LOT 66 Waverly Dr Unit 1
- LOT 65 Waverly Dr Unit 1
- LOT 46 Waverly Dr Unit 1
- LOT 45 Waverly Dr Unit 1
- LOT 44 Waverly Dr Unit 1
- LOT 43 Waverly Dr Unit 1
- LOT 42 Waverly Dr Unit 1
- LOT 40 Waverly Dr Unit 1
- LOT 39 Waverly Dr Unit 1
- 123 Cumberland Rd
- 201 Plum Orchard Rd
- 127 Cumberland Rd
- 118 Cumberland Rd
- 124 Cumberland Rd
- 203 Plum Orchard Rd
- 117 Maplewood Dr Unit 2
- 115 Cumberland Rd
- 0 Cumberland Rd Unit 7398993
- 0 Cumberland Rd Unit 8877289
- 0 Cumberland Rd Unit 8704245
- 0 Cumberland Rd Unit 8578945
- 0 Cumberland Rd Unit 8495550
- 0 Cumberland Rd Unit 8655655
- 0 Cumberland Rd Unit 7215163
- 115 Maplewood Dr Unit 11
- 115 Maplewood Dr
- 129 Cumberland Rd
- 112 Cumberland Rd
- 119 Maplewood Dr