Estimated Value: $145,000 - $176,000
3
Beds
1
Bath
1,216
Sq Ft
$137/Sq Ft
Est. Value
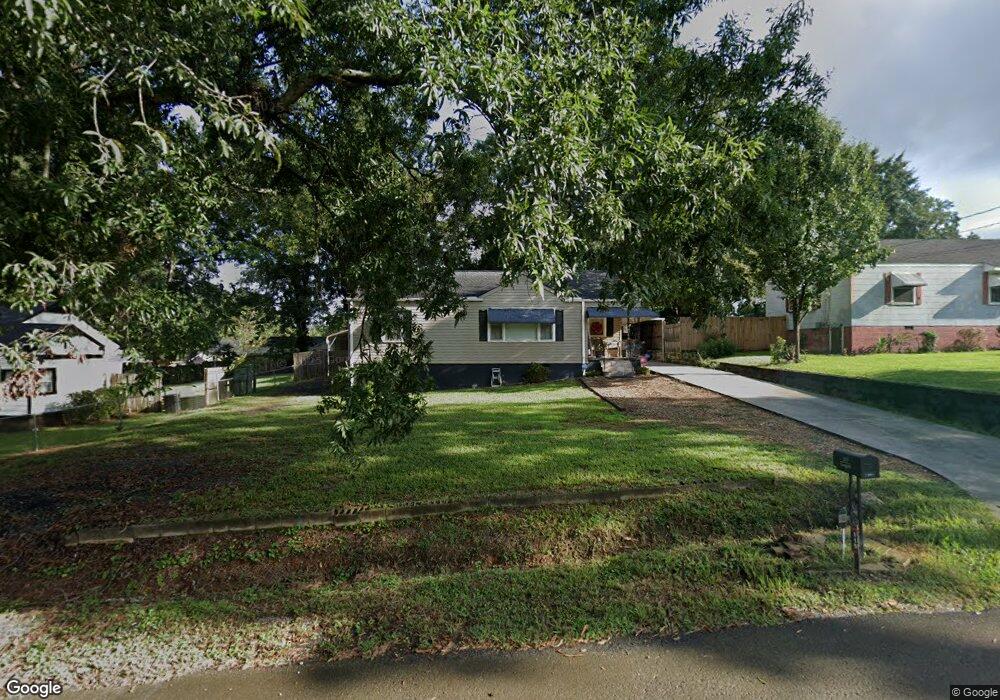
About This Home
This home is located at 119 E Juniper Way SE, Rome, GA 30161 and is currently estimated at $166,165, approximately $136 per square foot. 119 E Juniper Way SE is a home located in Floyd County with nearby schools including Pepperell Middle School, Pepperell High School, and Montessori School of Rome.
Ownership History
Date
Name
Owned For
Owner Type
Purchase Details
Closed on
Mar 18, 2020
Sold by
Callaway Charles
Bought by
Scoggins Mitchell
Current Estimated Value
Home Financials for this Owner
Home Financials are based on the most recent Mortgage that was taken out on this home.
Original Mortgage
$93,279
Outstanding Balance
$82,271
Interest Rate
3.62%
Mortgage Type
FHA
Estimated Equity
$83,894
Purchase Details
Closed on
Jul 29, 2003
Sold by
Smith Arthur L and Lillie May Smith
Bought by
Callaway Charles and Brooke Callaway
Purchase Details
Closed on
Sep 30, 2002
Sold by
Sharp Lois S
Bought by
Smith Arthur L and Lillie May Smith
Purchase Details
Closed on
Mar 20, 2002
Sold by
Sharp Charles T and Sharp Lois S
Bought by
Sharp Lois S
Purchase Details
Closed on
Mar 27, 2001
Bought by
P and R
Purchase Details
Closed on
Jan 3, 1997
Sold by
Sharp Chas T Sharp Chas T Sharp Chas
Bought by
Sharp Charles T and Sharp Lois S
Purchase Details
Closed on
Jan 1, 1901
Bought by
Sharp Chas T Sharp Chas T Sharp Cha
Create a Home Valuation Report for This Property
The Home Valuation Report is an in-depth analysis detailing your home's value as well as a comparison with similar homes in the area
Home Values in the Area
Average Home Value in this Area
Purchase History
| Date | Buyer | Sale Price | Title Company |
|---|---|---|---|
| Scoggins Mitchell | $95,000 | -- | |
| Callaway Charles | $70,700 | -- | |
| Smith Arthur L | $70,000 | -- | |
| P | -- | -- | |
| Sharp Lois S | -- | -- | |
| P | -- | -- | |
| Sharp Charles T | -- | -- | |
| Sharp Chas T Sharp Chas T Sharp Cha | -- | -- |
Source: Public Records
Mortgage History
| Date | Status | Borrower | Loan Amount |
|---|---|---|---|
| Open | Scoggins Mitchell | $93,279 |
Source: Public Records
Tax History
| Year | Tax Paid | Tax Assessment Tax Assessment Total Assessment is a certain percentage of the fair market value that is determined by local assessors to be the total taxable value of land and additions on the property. | Land | Improvement |
|---|---|---|---|---|
| 2025 | $1,927 | $65,638 | $4,620 | $61,018 |
| 2024 | $1,927 | $55,570 | $4,200 | $51,370 |
| 2023 | $1,637 | $53,688 | $3,600 | $50,088 |
| 2022 | $1,378 | $44,826 | $3,000 | $41,826 |
| 2021 | $1,282 | $40,945 | $3,000 | $37,945 |
| 2020 | $922 | $32,199 | $2,400 | $29,799 |
| 2019 | $779 | $27,750 | $2,400 | $25,350 |
| 2018 | $727 | $26,010 | $2,400 | $23,610 |
| 2017 | $697 | $24,960 | $2,400 | $22,560 |
| 2016 | $726 | $25,637 | $2,400 | $23,237 |
| 2015 | $713 | $25,637 | $2,400 | $23,237 |
| 2014 | $713 | $25,637 | $2,400 | $23,237 |
Source: Public Records
Map
Nearby Homes
- 2108 Maple Ave SW
- 7 Willingham St SW
- 2501 Maple Rd SE
- 2508 Maple Rd SE
- 118 Hosea St SW
- 111 Hosea St SW
- 0 Martha Berry Hwy Unit 7525627
- 0 Martha Berry Hwy Unit 7614774
- 0 Martha Berry Hwy Unit 10690106
- 0 Martha Berry Hwy Unit 10563404
- 2523 Maple Rd SE
- 2107 Rockmart Rd SE
- 2009 Hull Ave SW
- 212 Alfred Ave SE
- 304 E 19th St SW
- 27 Saddle Mountain Rd SE
- 2405 Rockmart Rd SE
- 407 E 19th St SW
- 26 Saddlebrook Dr SE
- 36 Saddle Mountain Rd SE
- 121 E Juniper Way SE
- 117 E Juniper Way SE
- 123 E Juniper Way SE
- 115 E Juniper Way SE
- 26 Lombardy Way SE
- 28 Lombardy Way SE
- 24 Lombardy Way SE
- 22 Lombardy Way SE
- 118 E Juniper Way SE
- 30 Lombardy Way SE
- 120 E Juniper Way SE
- 116 E Juniper Way SE
- 116 E Juniper Way SE
- 116 E Juniper Way SE
- 20 Lombardy Way SE
- 20 Lombardy Way SE Unit 27
- 113 E Juniper Way SE
- 122 E Juniper Way SE
- 1 Rosemont Dr SE
- 18 Lombardy Way SE
Your Personal Tour Guide
Ask me questions while you tour the home.