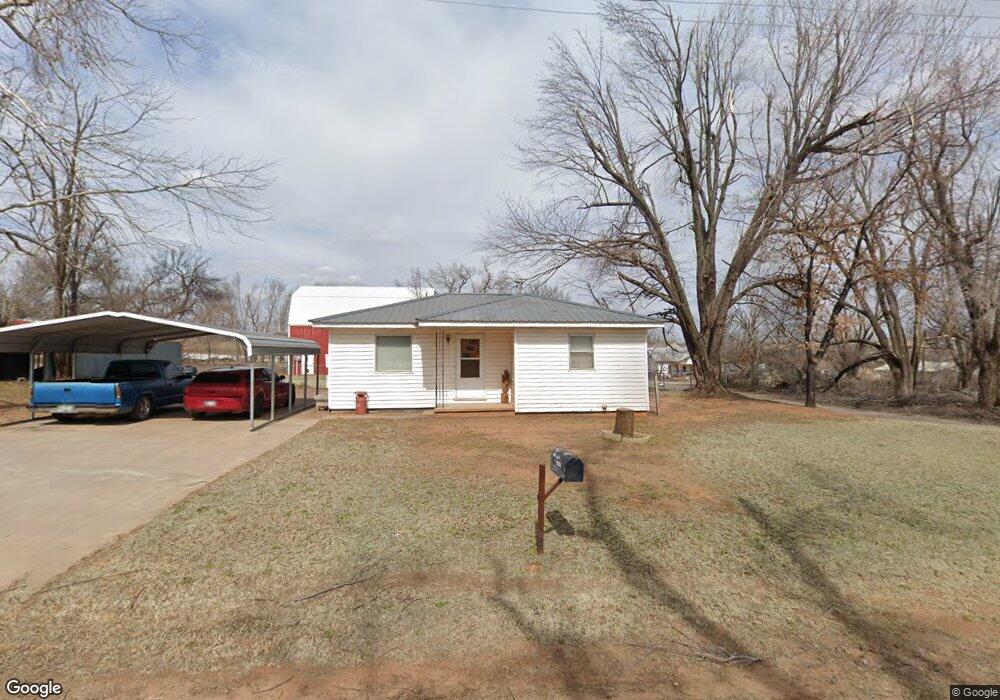
119 E Pine St Binger, OK 73009
Estimated Value: $48,145 - $118,000
2
Beds
1
Bath
820
Sq Ft
$101/Sq Ft
Est. Value
About This Home
This home is located at 119 E Pine St, Binger, OK 73009 and is currently estimated at $82,786, approximately $100 per square foot. 119 E Pine St is a home with nearby schools including Binger-Oney High School.
Ownership History
Date
Name
Owned For
Owner Type
Purchase Details
Closed on
Apr 19, 2019
Sold by
Mckenzie Gregory Randy Dale and Mckenzie Gregory Taryn
Bought by
Cross Gregory Randy Dale and Cross Gregory Shelby
Current Estimated Value
Home Financials for this Owner
Home Financials are based on the most recent Mortgage that was taken out on this home.
Original Mortgage
$16,630
Outstanding Balance
$14,561
Interest Rate
4.4%
Mortgage Type
Future Advance Clause Open End Mortgage
Estimated Equity
$68,225
Purchase Details
Closed on
Mar 15, 2019
Sold by
Patterson Tammy
Bought by
Gregory Randy Dale
Home Financials for this Owner
Home Financials are based on the most recent Mortgage that was taken out on this home.
Original Mortgage
$16,630
Outstanding Balance
$14,561
Interest Rate
4.4%
Mortgage Type
Future Advance Clause Open End Mortgage
Estimated Equity
$68,225
Purchase Details
Closed on
May 20, 2010
Sold by
Mcpherson Kenneth and Mcpherson Linda
Bought by
Mcpherson Kenneth
Purchase Details
Closed on
Aug 1, 2001
Create a Home Valuation Report for This Property
The Home Valuation Report is an in-depth analysis detailing your home's value as well as a comparison with similar homes in the area
Purchase History
| Date | Buyer | Sale Price | Title Company |
|---|---|---|---|
| Cross Gregory Randy Dale | -- | None Available | |
| Gregory Randy Dale | $30,000 | None Available | |
| Mcpherson Kenneth | $25,000 | -- | |
| -- | $22,500 | -- |
Source: Public Records
Mortgage History
| Date | Status | Borrower | Loan Amount |
|---|---|---|---|
| Open | Gregory Randy Dale | $16,630 |
Source: Public Records
Tax History
| Year | Tax Paid | Tax Assessment Tax Assessment Total Assessment is a certain percentage of the fair market value that is determined by local assessors to be the total taxable value of land and additions on the property. | Land | Improvement |
|---|---|---|---|---|
| 2025 | $181 | $2,033 | $0 | $2,033 |
| 2024 | $181 | $1,936 | $0 | $1,936 |
| 2023 | $177 | $1,844 | $0 | $1,844 |
| 2022 | $160 | $1,756 | $0 | $1,756 |
| 2021 | $161 | $1,673 | $0 | $1,673 |
| 2020 | $147 | $1,593 | $0 | $1,593 |
| 2019 | $140 | $1,517 | $0 | $1,517 |
| 2018 | $316 | $3,349 | $825 | $2,524 |
| 2017 | $317 | $3,345 | $825 | $2,520 |
| 2016 | $318 | $3,345 | $825 | $2,520 |
| 2015 | $282 | $3,345 | $825 | $2,520 |
| 2014 | $301 | $3,539 | $825 | $2,714 |
Source: Public Records
Map
Nearby Homes
- 404 S Broadway
- 107 E Johnny Bench
- 16115 Cs 2610 St
- 523 S 1st St
- 23155 County Street 2590
- 13090 County Street 2630
- 13090 County Road 1140
- 12168 U S 281
- 14140 County Road 1130
- 21133 County Street 2560
- 18115 N County Road 2530 Rd
- 1 Rainbow St
- 24147 County Street 2670
- 9175 County Road 1130 Rd
- 0 S Walbaum Rd
- 18115 N 2530 St
- 310 Ellen Way
- 7173 County Road 1160
- 22847 74th St SW
- 713 Whispering Water Dr
Your Personal Tour Guide
Ask me questions while you tour the home.