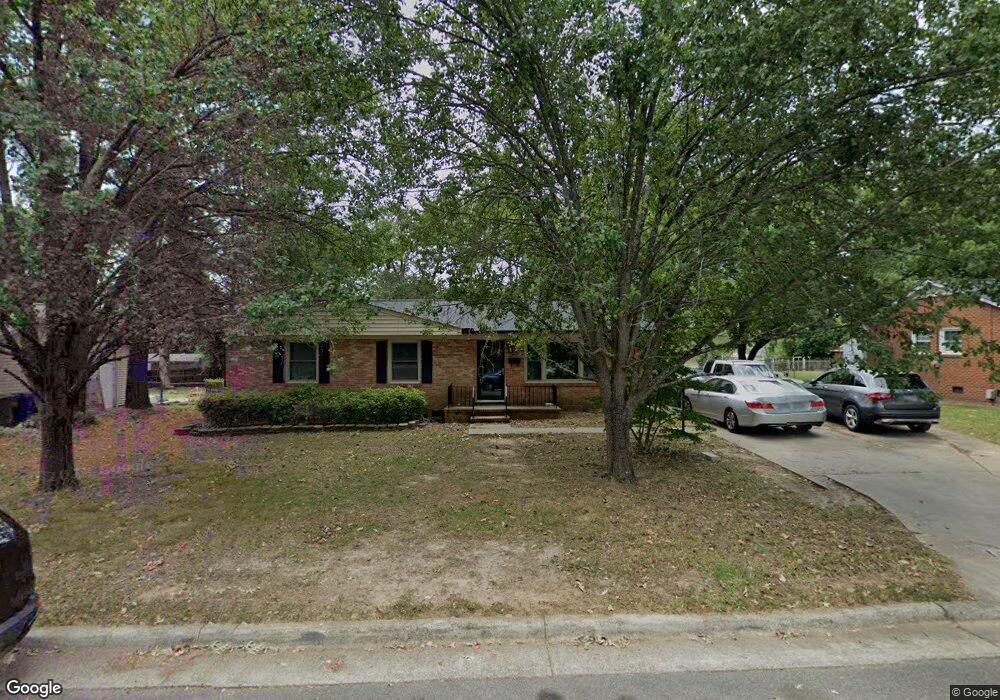
119 Eastway Ln Graham, NC 27253
Estimated Value: $218,266 - $233,000
3
Beds
2
Baths
1,150
Sq Ft
$198/Sq Ft
Est. Value
About This Home
This home is located at 119 Eastway Ln, Graham, NC 27253 and is currently estimated at $227,817, approximately $198 per square foot. 119 Eastway Ln is a home located in Alamance County with nearby schools including South Graham Elementary School, Southern Alamance Middle School, and Southern Alamance High School.
Ownership History
Date
Name
Owned For
Owner Type
Purchase Details
Closed on
Jun 8, 2009
Sold by
Home Court Advantage Llc
Bought by
Snipes Antwon
Current Estimated Value
Home Financials for this Owner
Home Financials are based on the most recent Mortgage that was taken out on this home.
Original Mortgage
$108,007
Outstanding Balance
$68,351
Interest Rate
4.8%
Mortgage Type
FHA
Estimated Equity
$159,466
Purchase Details
Closed on
Jun 25, 2002
Sold by
Messenger Eric J
Bought by
Santos Pablo P
Home Financials for this Owner
Home Financials are based on the most recent Mortgage that was taken out on this home.
Original Mortgage
$101,350
Interest Rate
6.52%
Purchase Details
Closed on
Aug 15, 2000
Sold by
Cedar Creek Land Co L L C
Bought by
Messenger Eric J
Home Financials for this Owner
Home Financials are based on the most recent Mortgage that was taken out on this home.
Original Mortgage
$19,790
Interest Rate
8.17%
Create a Home Valuation Report for This Property
The Home Valuation Report is an in-depth analysis detailing your home's value as well as a comparison with similar homes in the area
Home Values in the Area
Average Home Value in this Area
Purchase History
| Date | Buyer | Sale Price | Title Company |
|---|---|---|---|
| Snipes Antwon | $110,000 | -- | |
| Santos Pablo P | $103,000 | -- | |
| Messenger Eric J | $22,000 | -- |
Source: Public Records
Mortgage History
| Date | Status | Borrower | Loan Amount |
|---|---|---|---|
| Open | Snipes Antwon | $108,007 | |
| Previous Owner | Santos Pablo P | $101,350 | |
| Previous Owner | Messenger Eric J | $19,790 |
Source: Public Records
Tax History Compared to Growth
Tax History
| Year | Tax Paid | Tax Assessment Tax Assessment Total Assessment is a certain percentage of the fair market value that is determined by local assessors to be the total taxable value of land and additions on the property. | Land | Improvement |
|---|---|---|---|---|
| 2025 | $963 | $195,004 | $28,000 | $167,004 |
| 2024 | $915 | $195,004 | $28,000 | $167,004 |
| 2023 | $838 | $195,004 | $28,000 | $167,004 |
| 2022 | $1,022 | $92,780 | $20,000 | $72,780 |
| 2021 | $1,031 | $92,780 | $20,000 | $72,780 |
| 2020 | $1,041 | $92,780 | $20,000 | $72,780 |
| 2019 | $1,044 | $92,780 | $20,000 | $72,780 |
| 2018 | $0 | $92,780 | $20,000 | $72,780 |
| 2017 | $535 | $92,780 | $20,000 | $72,780 |
| 2016 | $968 | $93,513 | $25,000 | $68,513 |
| 2015 | $540 | $93,513 | $25,000 | $68,513 |
| 2014 | $493 | $93,513 | $25,000 | $68,513 |
Source: Public Records
Map
Nearby Homes
- 306 Eastway Ln
- 109 Florence St
- 516 Ivey Rd
- 139 Webster Rd
- 101 Haley Ct
- 00 Wilton Dr
- 308 Aloha Dr
- 1115 Lorraine St
- 2094 Chandler Village Dr
- 2048 Chandler Village Dr
- 2022 Chandler Village Dr
- 218 Braeburn Dr
- 680 Winesap Dr
- 316 Cheeks Ln
- 304 Field St
- 615 Paris St
- 1321 Adler Cove Rd
- 1311 Adler Cove Rd
- 627 Carraway Dr
- Lot 54 Forest Dr