119 Ebner St Boerne, TX 78006
Estimated payment $7,181/month
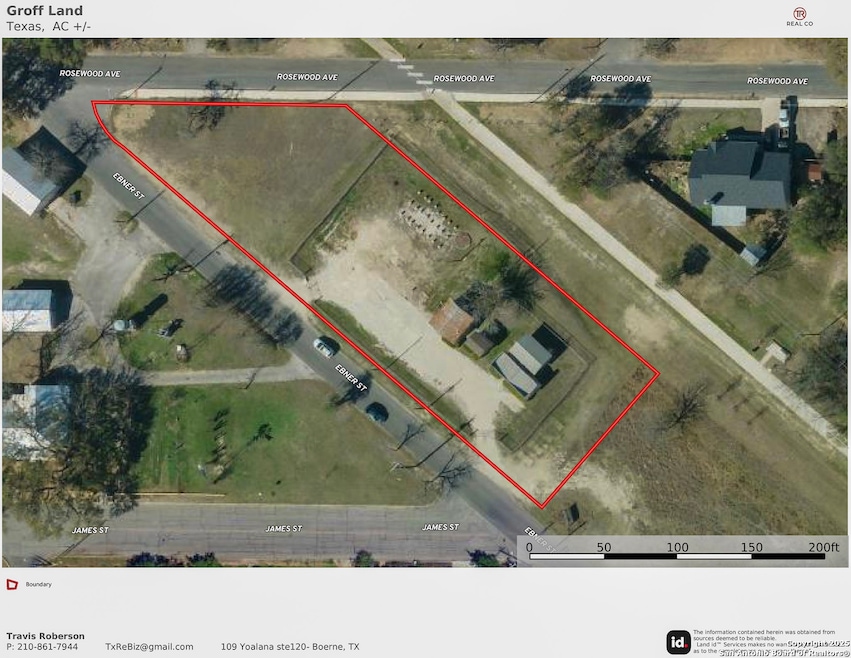
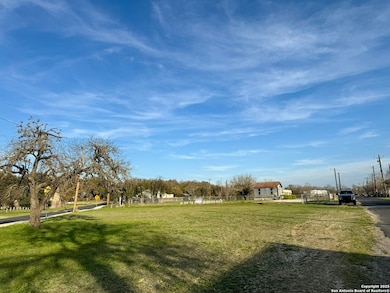
About This Lot
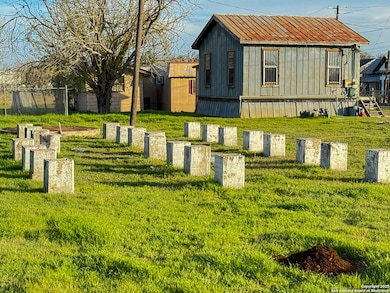
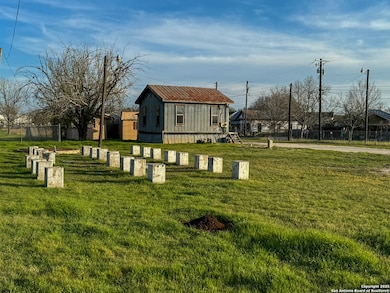
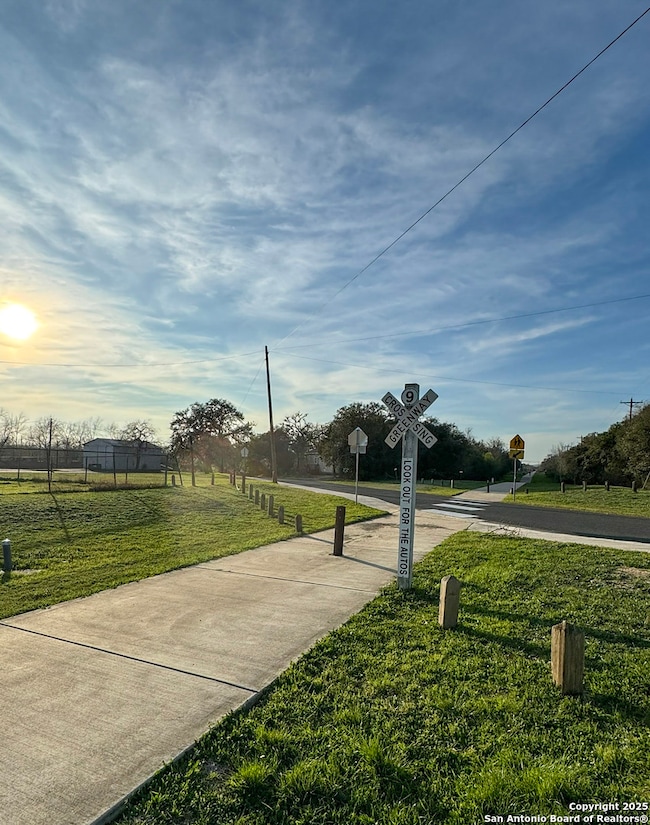
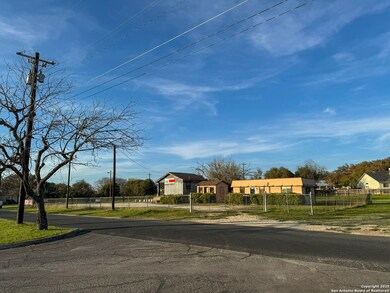
1+ acre on the Historic Old #9 Downtown walking Trail in Boerne Tx! * Zoned C1- Downtown District Overlay*- Allows for Townhomes attached or detached. * 400+ Feet of Frontage on Hard corner. * Next door to brand new Robert Thornton LP Development- Boerne Station Lot could be mixed use, residential lots with zero lot lines or Light Commercial. Walk out the back door and be on the paved Hike and Bike Trail! Owner may sell all or part. Current improvements scheduled to be demolished. Contact your Broker for more info.
Property Details
Property Type
- Land
Est. Annual Taxes
- $4,117
Lot Details
- 1.18 Acre Lot
- Property is zoned C1
Community Details
- M I Leal Acreage Subdivision
Listing and Financial Details
- Tax Block 1
- Assessor Parcel Number 1501000000070
Map
Home Values in the Area
Average Home Value in this Area
Tax History
| Year | Tax Paid | Tax Assessment Tax Assessment Total Assessment is a certain percentage of the fair market value that is determined by local assessors to be the total taxable value of land and additions on the property. | Land | Improvement |
|---|---|---|---|---|
| 2025 | $4,103 | $221,759 | $191,914 | $29,845 |
| 2024 | $4,103 | $221,759 | $191,914 | $29,845 |
| 2023 | $4,119 | $221,759 | $191,914 | $29,845 |
| 2022 | $4,375 | $216,350 | $184,470 | $31,880 |
| 2021 | $2,326 | $108,610 | $84,230 | $24,380 |
| 2020 | $2,361 | $108,610 | $84,230 | $24,380 |
| 2019 | $2,437 | $108,610 | $84,230 | $24,380 |
| 2018 | $2,437 | $108,610 | $84,230 | $24,380 |
| 2017 | $2,396 | $108,610 | $84,230 | $24,380 |
| 2016 | $2,396 | $108,610 | $84,230 | $24,380 |
Property History
| Date | Event | Price | List to Sale | Price per Sq Ft |
|---|---|---|---|---|
| 11/22/2025 11/22/25 | For Sale | $1,300,000 | -- | -- |
Source: San Antonio Board of REALTORS®
MLS Number: 1924696
APN: 18954
Disclaimer: Certain information contained herein is derived from information provided by parties other than Homes.com. All information provided is deemed reliable, but is not guaranteed to be accurate and should be independently verified.
![]() IDX information is provided exclusively for personal, non-commercial use, and may not be used for any purpose other than to identify prospective properties consumers may be interested in purchasing.
IDX information is provided exclusively for personal, non-commercial use, and may not be used for any purpose other than to identify prospective properties consumers may be interested in purchasing.
Information is deemed reliable but not guaranteed.
- 311 Ebner St
- 612 E Theissen St
- 112 Shadywood
- 314 S Plant Ave
- 121 S Plant Ave Unit 102
- 313 James St
- 115 Stahl St
- 1025 E Blanco Rd
- 103 Aransas Pass
- 25826 Marigold Oaks
- 25819 Posey Dr
- 143 Sonrisa
- 115 Pecan St
- 13 Bella Collina Rd
- 207 Ivy Ln
- 901 River Rd
- 120 Dawn Dr
- 305 E Hosack St
- 103 Surrey Dr
- 129 E Evergreen St
- 400 E Rosewood Ave
- 239 W Granite Shores Dr
- 1005 E Blanco Rd
- 711 River Rd
- 116 E Evergreen St
- 150 Medical Dr
- 309 S Brackenridge
- 402 Herff St
- 408 Herff St
- 210 English Oaks Cir
- 143 Oak Grove Dr
- 701 Oak Park Dr
- 111 N Brackenridge
- 225 North St
- 130 Gallant Fox Ln
- 106 Retama Rd
- 213 Champion Blvd
- 328 Bentwood Dr
- 1000 Diamond Dr Unit 3003
- 1000 Diamond Dr Unit 1301

Ask me questions while you tour the home.