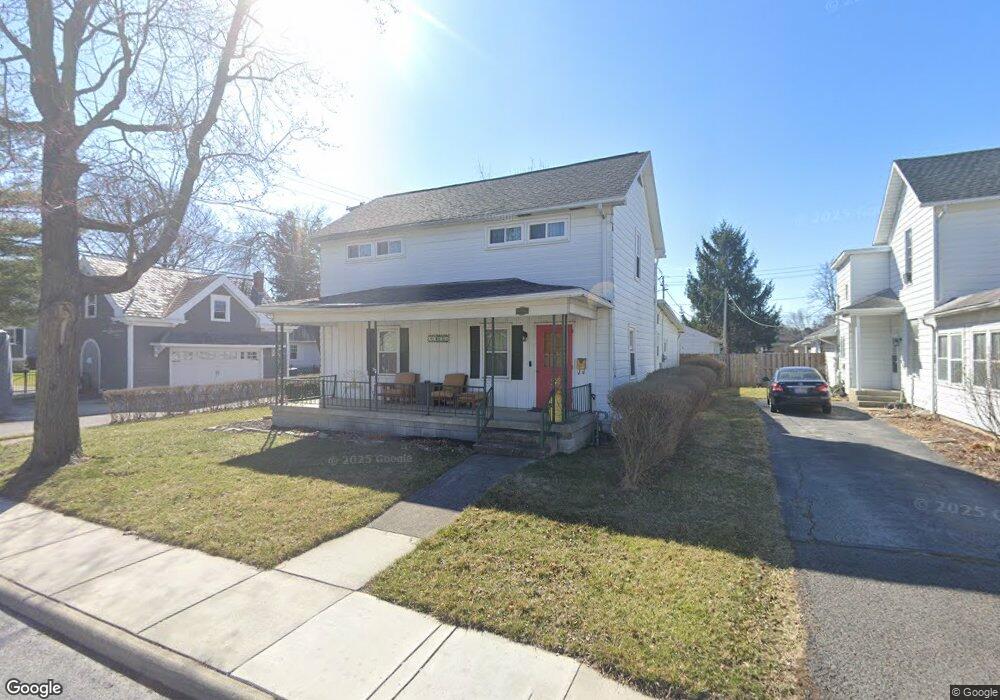
119 Elm St Findlay, OH 45840
Estimated Value: $224,456 - $249,000
4
Beds
2
Baths
2,041
Sq Ft
$117/Sq Ft
Est. Value
About This Home
This home is located at 119 Elm St, Findlay, OH 45840 and is currently estimated at $238,614, approximately $116 per square foot. 119 Elm St is a home located in Hancock County with nearby schools including Lincoln Elementary School, Donnell Middle School, and Findlay High School.
Ownership History
Date
Name
Owned For
Owner Type
Purchase Details
Closed on
May 21, 2019
Sold by
Kiesler Kelli M
Bought by
Gresham Todd
Current Estimated Value
Home Financials for this Owner
Home Financials are based on the most recent Mortgage that was taken out on this home.
Original Mortgage
$116,000
Outstanding Balance
$75,706
Interest Rate
4.2%
Mortgage Type
New Conventional
Estimated Equity
$162,908
Purchase Details
Closed on
May 22, 2001
Sold by
Trst Judy W Mieure
Bought by
Kiesler Keili
Home Financials for this Owner
Home Financials are based on the most recent Mortgage that was taken out on this home.
Original Mortgage
$101,000
Interest Rate
7.02%
Mortgage Type
New Conventional
Purchase Details
Closed on
Aug 2, 1995
Sold by
Phillips William
Bought by
Mieure Donald and Mieure Judy
Purchase Details
Closed on
Nov 26, 1990
Bought by
Phillips Anna Rose
Purchase Details
Closed on
Jul 28, 1983
Bought by
Phillips William W and Phillips Anna
Create a Home Valuation Report for This Property
The Home Valuation Report is an in-depth analysis detailing your home's value as well as a comparison with similar homes in the area
Home Values in the Area
Average Home Value in this Area
Purchase History
| Date | Buyer | Sale Price | Title Company |
|---|---|---|---|
| Gresham Todd | -- | E Title Services | |
| Kiesler Keili | $99,600 | -- | |
| Mieure Donald | $105,000 | -- | |
| Phillips Anna Rose | -- | -- | |
| Phillips William W | -- | -- |
Source: Public Records
Mortgage History
| Date | Status | Borrower | Loan Amount |
|---|---|---|---|
| Open | Gresham Todd | $116,000 | |
| Previous Owner | Kiesler Keili | $101,000 |
Source: Public Records
Tax History Compared to Growth
Tax History
| Year | Tax Paid | Tax Assessment Tax Assessment Total Assessment is a certain percentage of the fair market value that is determined by local assessors to be the total taxable value of land and additions on the property. | Land | Improvement |
|---|---|---|---|---|
| 2024 | $1,954 | $55,010 | $7,670 | $47,340 |
| 2023 | $1,957 | $55,010 | $7,670 | $47,340 |
| 2022 | $1,950 | $55,010 | $7,670 | $47,340 |
| 2021 | $1,892 | $46,490 | $7,850 | $38,640 |
| 2020 | $1,892 | $46,490 | $7,850 | $38,640 |
| 2019 | $1,854 | $46,490 | $7,850 | $38,640 |
| 2018 | $1,743 | $40,070 | $5,530 | $34,540 |
| 2017 | $1,742 | $40,070 | $5,530 | $34,540 |
| 2016 | $1,721 | $40,070 | $5,530 | $34,540 |
| 2015 | $1,373 | $31,390 | $5,530 | $25,860 |
| 2014 | $1,373 | $31,390 | $5,530 | $25,860 |
| 2012 | $1,237 | $28,020 | $5,530 | $22,490 |
Source: Public Records
Map
Nearby Homes