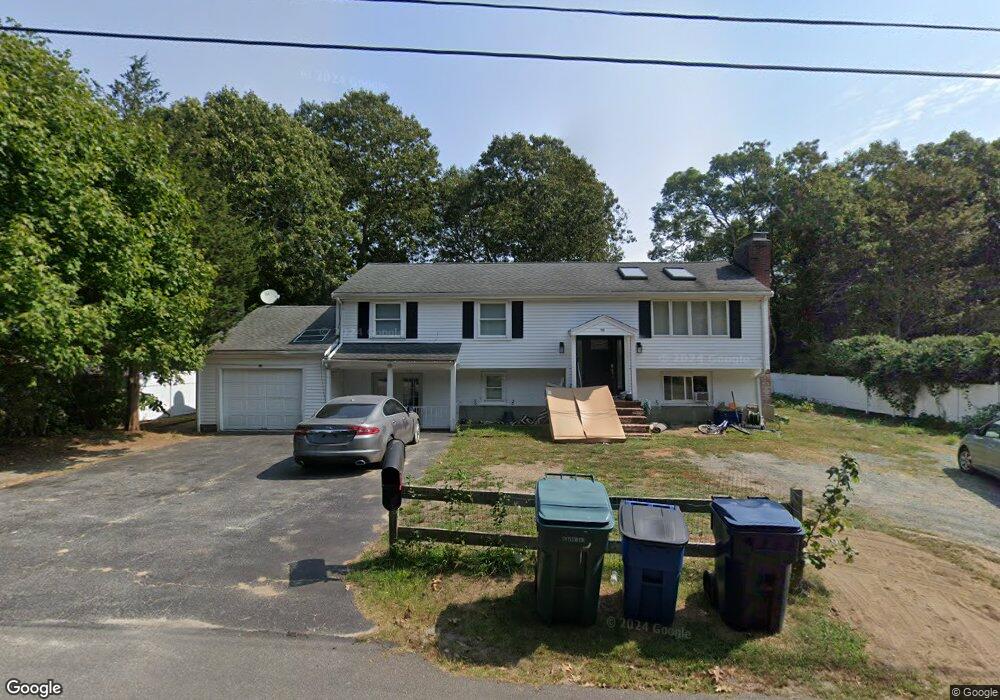
119 Emerson Way Centerville, MA 02632
Centerville NeighborhoodEstimated Value: $638,294 - $721,000
5
Beds
3
Baths
2,464
Sq Ft
$272/Sq Ft
Est. Value
About This Home
This home is located at 119 Emerson Way, Centerville, MA 02632 and is currently estimated at $670,324, approximately $272 per square foot. 119 Emerson Way is a home located in Barnstable County with nearby schools including Centerville Elementary School, Barnstable United Elementary School, and Barnstable Intermediate School.
Ownership History
Date
Name
Owned For
Owner Type
Purchase Details
Closed on
Jan 23, 2008
Sold by
Nyman James A
Bought by
Fuller Anastasia Zinov
Current Estimated Value
Home Financials for this Owner
Home Financials are based on the most recent Mortgage that was taken out on this home.
Original Mortgage
$34,000
Outstanding Balance
$21,473
Interest Rate
6.17%
Mortgage Type
Purchase Money Mortgage
Estimated Equity
$648,851
Purchase Details
Closed on
Jan 9, 2004
Sold by
Crooks Arthur B and Dew Richard B
Bought by
Nyman James A
Purchase Details
Closed on
Apr 30, 1998
Sold by
Dew Richard B
Bought by
Dew Richard B
Purchase Details
Closed on
Jun 24, 1994
Sold by
Norkunas Stanley and Aukstikalnis Jurate E
Bought by
Dew Richard B
Home Financials for this Owner
Home Financials are based on the most recent Mortgage that was taken out on this home.
Original Mortgage
$70,000
Interest Rate
8.74%
Mortgage Type
Purchase Money Mortgage
Create a Home Valuation Report for This Property
The Home Valuation Report is an in-depth analysis detailing your home's value as well as a comparison with similar homes in the area
Home Values in the Area
Average Home Value in this Area
Purchase History
| Date | Buyer | Sale Price | Title Company |
|---|---|---|---|
| Fuller Anastasia Zinov | $339,000 | -- | |
| Nyman James A | $264,000 | -- | |
| Dew Richard B | $11,000 | -- | |
| Dew Richard B | $140,000 | -- |
Source: Public Records
Mortgage History
| Date | Status | Borrower | Loan Amount |
|---|---|---|---|
| Open | Fuller Anastasia Zinov | $34,000 | |
| Previous Owner | Dew Richard B | $70,000 |
Source: Public Records
Tax History
| Year | Tax Paid | Tax Assessment Tax Assessment Total Assessment is a certain percentage of the fair market value that is determined by local assessors to be the total taxable value of land and additions on the property. | Land | Improvement |
|---|---|---|---|---|
| 2025 | $4,348 | $537,500 | $168,700 | $368,800 |
| 2024 | $4,269 | $546,600 | $168,700 | $377,900 |
| 2023 | $4,115 | $493,400 | $166,700 | $326,700 |
| 2022 | $3,833 | $397,600 | $118,500 | $279,100 |
| 2021 | $3,819 | $364,100 | $118,500 | $245,600 |
| 2020 | $3,867 | $352,800 | $118,500 | $234,300 |
| 2019 | $3,599 | $319,100 | $118,500 | $200,600 |
| 2018 | $3,387 | $301,900 | $130,000 | $171,900 |
| 2017 | $3,194 | $296,800 | $130,000 | $166,800 |
| 2016 | $3,474 | $318,700 | $132,200 | $186,500 |
| 2015 | $3,128 | $288,300 | $126,100 | $162,200 |
Source: Public Records
Map
Nearby Homes
- 53 Meadow Farm Rd
- 52 Meadow Farm Rd
- 103 Pine Tree Dr
- 51 Larch Ln
- 19 Marrick Ct
- 82 Yacht Club Rd
- 156 S Main St
- 40 Sachem Dr
- 200 Lumbert Mill Rd
- 296 Buckskin Path
- 12 S Cedar Rd
- 315 Prince Hinckley Rd
- 290 Riverview Ln
- 83 Lake Dr
- 180 Pond View Dr
- 10 Sail a Way
- 10 Sail -A-way
- 443 Elliott Rd
- 818 S Main St
- 498 Elliott Rd
- 129 Emerson Way
- 109 Emerson Way
- 47 Marie Ann Terrace
- 112 Emerson Way
- 132 Emerson Way
- 139 Emerson Way
- 39 Marie Ann Terrace
- 99 Emerson Way
- 139 Longfellow Dr
- 100 Emerson Way
- 23 Marie-Ann Terrace
- 67 Marie-Ann Terrace
- 67 Marie Ann Terrace
- 120 Longfellow Dr
- 46 Marie Ann Terrace
- 164 Fuller Rd
- 129 Longfellow Dr
- 23 Marie Ann Terrace
- 89 Emerson Way
- 156 Fuller Rd
Your Personal Tour Guide
Ask me questions while you tour the home.