Estimated Value: $47,000 - $83,928
2
Beds
1
Bath
1,082
Sq Ft
$64/Sq Ft
Est. Value
About This Home
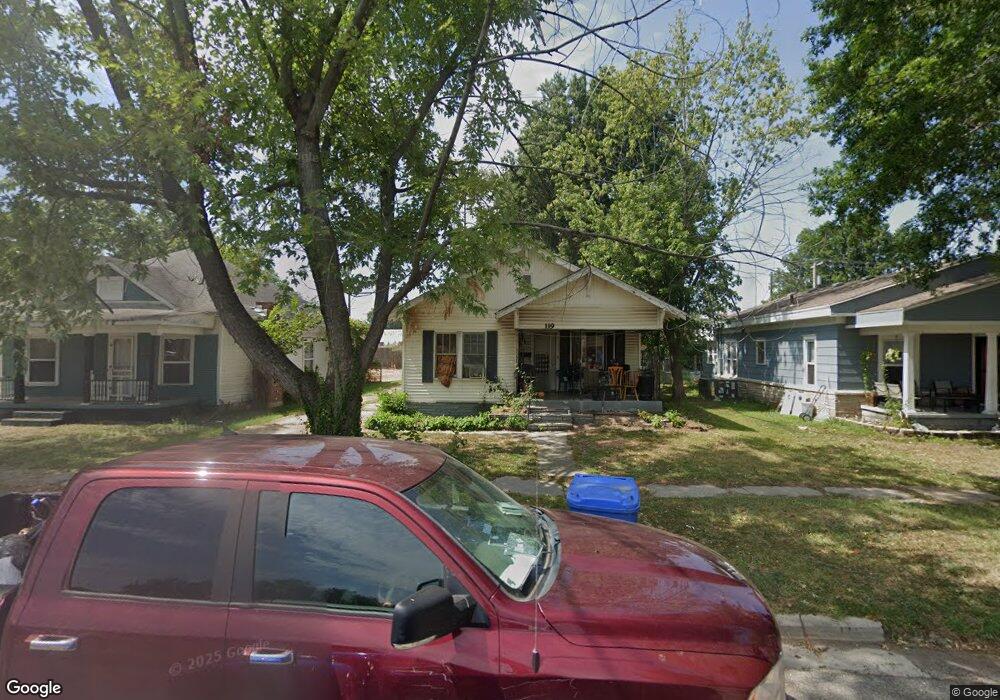
This home is located at 119 F St NE, Miami, OK 74354 and is currently estimated at $69,482, approximately $64 per square foot. 119 F St NE is a home located in Ottawa County with nearby schools including Miami High School and Mt. Olive Lutheran School.
Ownership History
Date
Name
Owned For
Owner Type
Purchase Details
Closed on
Apr 17, 2008
Sold by
Foster Dustin B
Bought by
Andras Robert James
Current Estimated Value
Home Financials for this Owner
Home Financials are based on the most recent Mortgage that was taken out on this home.
Original Mortgage
$46,175
Outstanding Balance
$28,920
Interest Rate
5.84%
Mortgage Type
FHA
Estimated Equity
$40,562
Purchase Details
Closed on
Jan 26, 2007
Sold by
Citifinancial Mortgage Co Inc
Bought by
Foster Dustin B
Purchase Details
Closed on
Dec 29, 2006
Sold by
Federal National Mortgage Association
Bought by
Citifinancial Mortgage Co Inc
Purchase Details
Closed on
Nov 8, 2006
Sold by
Stepp Richard and Stepp Janet
Bought by
Federal National Mortgage Association
Purchase Details
Closed on
Apr 2, 2003
Bought by
Western United Life
Purchase Details
Closed on
Feb 25, 1999
Bought by
Salmon Jack E
Create a Home Valuation Report for This Property
The Home Valuation Report is an in-depth analysis detailing your home's value as well as a comparison with similar homes in the area
Home Values in the Area
Average Home Value in this Area
Purchase History
| Date | Buyer | Sale Price | Title Company |
|---|---|---|---|
| Andras Robert James | $47,000 | None Available | |
| Foster Dustin B | $18,000 | Oklahoma Reo Closing & Title | |
| Citifinancial Mortgage Co Inc | -- | None Available | |
| Federal National Mortgage Association | $41,532 | None Available | |
| Western United Life | $27,000 | -- | |
| Salmon Jack E | $26,000 | -- |
Source: Public Records
Mortgage History
| Date | Status | Borrower | Loan Amount |
|---|---|---|---|
| Open | Andras Robert James | $46,175 |
Source: Public Records
Tax History Compared to Growth
Tax History
| Year | Tax Paid | Tax Assessment Tax Assessment Total Assessment is a certain percentage of the fair market value that is determined by local assessors to be the total taxable value of land and additions on the property. | Land | Improvement |
|---|---|---|---|---|
| 2025 | $511 | $4,515 | $342 | $4,173 |
| 2024 | $511 | $5,299 | $342 | $4,957 |
| 2023 | $511 | $5,713 | $342 | $5,371 |
| 2022 | $503 | $5,441 | $342 | $5,099 |
| 2021 | $490 | $5,182 | $342 | $4,840 |
| 2020 | $470 | $4,935 | $342 | $4,593 |
| 2019 | $438 | $5,334 | $342 | $4,992 |
| 2018 | $441 | $5,334 | $342 | $4,992 |
| 2017 | $448 | $5,334 | $342 | $4,992 |
| 2016 | $443 | $5,512 | $342 | $5,170 |
| 2015 | $273 | $3,078 | $310 | $2,768 |
| 2014 | $439 | $5,358 | $1,072 | $4,286 |
Source: Public Records
Map
Nearby Homes