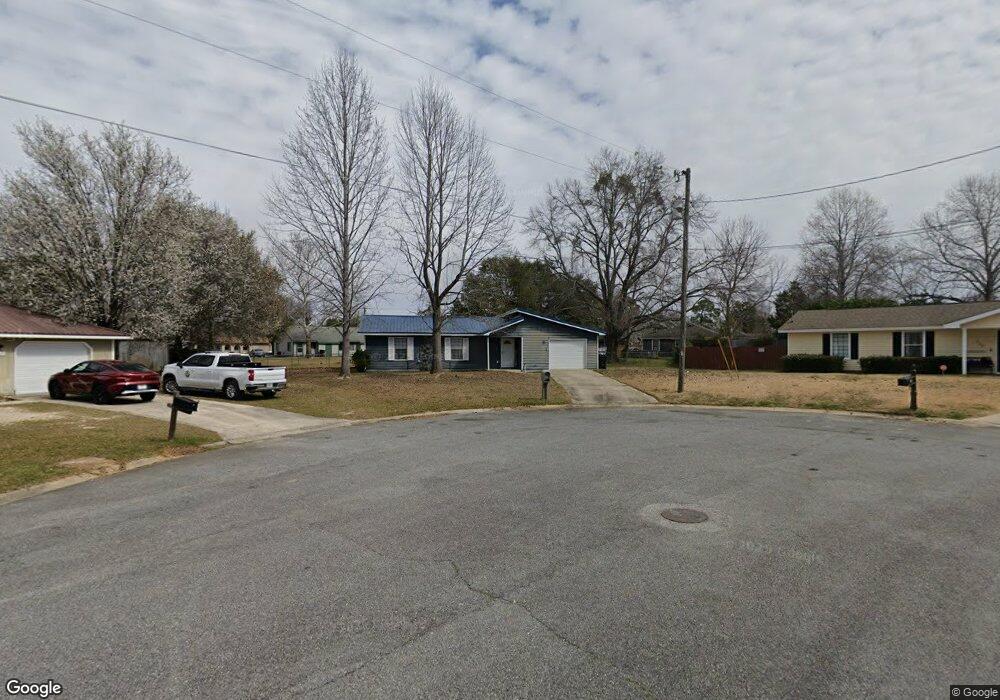
119 Fairfield Ct Warner Robins, GA 31093
Estimated Value: $142,000 - $175,546
3
Beds
2
Baths
1,090
Sq Ft
$146/Sq Ft
Est. Value
About This Home
This home is located at 119 Fairfield Ct, Warner Robins, GA 31093 and is currently estimated at $159,387, approximately $146 per square foot. 119 Fairfield Ct is a home located in Houston County with nearby schools including Centerville Elementary School, Northside Middle School, and Northside High School.
Ownership History
Date
Name
Owned For
Owner Type
Purchase Details
Closed on
Oct 19, 2020
Sold by
Banks Christopher Lee
Bought by
Ogiesby Erin J
Current Estimated Value
Home Financials for this Owner
Home Financials are based on the most recent Mortgage that was taken out on this home.
Original Mortgage
$71,200
Outstanding Balance
$38,676
Interest Rate
2.8%
Mortgage Type
Future Advance Clause Open End Mortgage
Estimated Equity
$120,711
Purchase Details
Closed on
Apr 30, 2007
Sold by
Richmond Christopher D
Bought by
Banks Christopher Lee
Home Financials for this Owner
Home Financials are based on the most recent Mortgage that was taken out on this home.
Original Mortgage
$82,000
Interest Rate
6.1%
Mortgage Type
New Conventional
Purchase Details
Closed on
Sep 25, 2000
Bought by
Richmond Christopher D
Create a Home Valuation Report for This Property
The Home Valuation Report is an in-depth analysis detailing your home's value as well as a comparison with similar homes in the area
Home Values in the Area
Average Home Value in this Area
Purchase History
| Date | Buyer | Sale Price | Title Company |
|---|---|---|---|
| Ogiesby Erin J | $89,000 | None Available | |
| Banks Christopher Lee | $82,000 | None Available | |
| Richmond Christopher D | $68,700 | -- |
Source: Public Records
Mortgage History
| Date | Status | Borrower | Loan Amount |
|---|---|---|---|
| Open | Ogiesby Erin J | $71,200 | |
| Previous Owner | Banks Christopher Lee | $82,000 |
Source: Public Records
Tax History Compared to Growth
Tax History
| Year | Tax Paid | Tax Assessment Tax Assessment Total Assessment is a certain percentage of the fair market value that is determined by local assessors to be the total taxable value of land and additions on the property. | Land | Improvement |
|---|---|---|---|---|
| 2024 | $1,723 | $52,640 | $8,000 | $44,640 |
| 2023 | $1,469 | $44,560 | $8,000 | $36,560 |
| 2022 | $863 | $37,520 | $7,200 | $30,320 |
| 2021 | $752 | $32,520 | $5,400 | $27,120 |
| 2020 | $624 | $26,880 | $5,400 | $21,480 |
| 2019 | $624 | $26,880 | $5,400 | $21,480 |
| 2018 | $624 | $26,880 | $5,400 | $21,480 |
| 2017 | $625 | $26,880 | $5,400 | $21,480 |
| 2016 | $626 | $26,880 | $5,400 | $21,480 |
| 2015 | -- | $26,880 | $5,400 | $21,480 |
| 2014 | $292 | $26,880 | $5,400 | $21,480 |
| 2013 | $292 | $27,040 | $5,400 | $21,640 |
Source: Public Records
Map
Nearby Homes
- 403 Fieldstone Rd
- 107 Stonefield Ct
- 102 Heritage Dr
- 136 Scarborough Rd
- 111 Red Oak Glen
- 106 Maple Glen Ct
- 103 Persimmon Glen Ct
- 213 Dogwood Glen
- 102 Montiego Ct
- 106 Tor Dr
- 102 Pine Glen Ct
- 94 Tiffany Ln
- 60 Tiffany Ln
- 152 Rock Run Trail
- 131 Martin Mill Trail
- 224 Crestwood Cir
- 918 Collins Ave Unit 36
- 112 Willow Glen
- 117 Fairfield Ct
- 112 Fairfield Ct
- 511 Scarborough Rd
- 902 Dunbar Rd
- 906 Dunbar Rd
- 509 Scarborough Rd
- 505 Scarborough Rd
- 515 Scarborough Rd
- 110 Fairfield Ct
- 115 Fairfield Ct
- 910 Dunbar Rd
- 507 Scarborough Rd
- 108 Fairfield Ct
- 914 Dunbar Rd
- 503 Scarborough Rd
- 113 Fairfield Ct
- 106 Fairfield Ct
- 708 Fieldstone Rd
- 502 Scarborough Rd
- 706 Fieldstone Rd