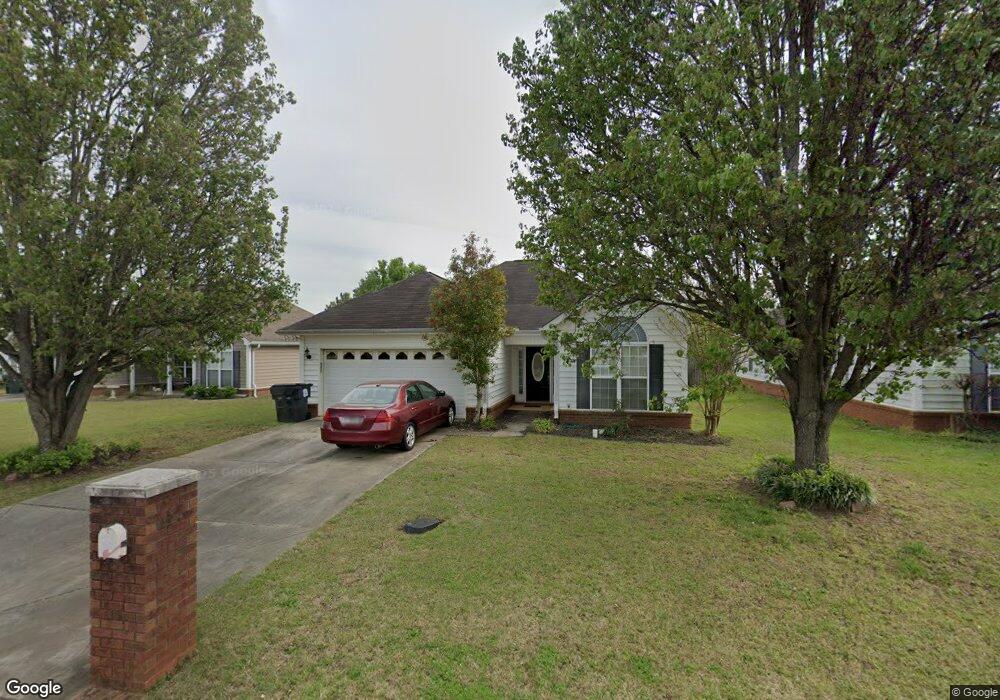
119 Gailey Ct Warner Robins, GA 31088
Estimated Value: $206,000 - $247,000
Studio
1
Bath
1,472
Sq Ft
$156/Sq Ft
Est. Value
About This Home
This home is located at 119 Gailey Ct, Warner Robins, GA 31088 and is currently estimated at $229,758, approximately $156 per square foot. 119 Gailey Ct is a home located in Houston County with nearby schools including David A. Perdue Primary School, David A. Perdue Elementary School, and Feagin Mill Middle School.
Ownership History
Date
Name
Owned For
Owner Type
Purchase Details
Closed on
Dec 30, 2005
Sold by
Love Steven
Bought by
Latimore Javonna E
Current Estimated Value
Home Financials for this Owner
Home Financials are based on the most recent Mortgage that was taken out on this home.
Original Mortgage
$120,000
Outstanding Balance
$65,130
Interest Rate
6.28%
Mortgage Type
New Conventional
Estimated Equity
$164,628
Purchase Details
Closed on
Dec 29, 2005
Sold by
Love Kasey L
Bought by
Love Steven L
Home Financials for this Owner
Home Financials are based on the most recent Mortgage that was taken out on this home.
Original Mortgage
$120,000
Outstanding Balance
$65,130
Interest Rate
6.28%
Mortgage Type
New Conventional
Estimated Equity
$164,628
Purchase Details
Closed on
Apr 16, 2004
Sold by
Bridges & Davidson Builders Ll
Bought by
Love Steven L & Kasey L
Purchase Details
Closed on
Mar 6, 2003
Sold by
Sun King Inc
Bought by
Bridges & Davidson Builders Llc
Create a Home Valuation Report for This Property
The Home Valuation Report is an in-depth analysis detailing your home's value as well as a comparison with similar homes in the area
Home Values in the Area
Average Home Value in this Area
Purchase History
| Date | Buyer | Sale Price | Title Company |
|---|---|---|---|
| Latimore Javonna E | $120,000 | None Available | |
| Love Steven L | -- | None Available | |
| Love Steven L & Kasey L | $112,500 | -- | |
| Bridges & Davidson Builders Llc | $17,900 | -- |
Source: Public Records
Mortgage History
| Date | Status | Borrower | Loan Amount |
|---|---|---|---|
| Open | Latimore Javonna E | $120,000 |
Source: Public Records
Tax History
| Year | Tax Paid | Tax Assessment Tax Assessment Total Assessment is a certain percentage of the fair market value that is determined by local assessors to be the total taxable value of land and additions on the property. | Land | Improvement |
|---|---|---|---|---|
| 2025 | $2,293 | $83,880 | $10,800 | $73,080 |
| 2024 | $2,494 | $77,600 | $9,600 | $68,000 |
| 2023 | $2,124 | $65,800 | $8,800 | $57,000 |
| 2022 | $1,348 | $60,640 | $8,800 | $51,840 |
| 2021 | $1,123 | $50,560 | $8,800 | $41,760 |
| 2020 | $1,002 | $45,120 | $8,800 | $36,320 |
| 2019 | $1,002 | $45,120 | $8,800 | $36,320 |
| 2018 | $1,002 | $45,120 | $8,800 | $36,320 |
| 2017 | $1,003 | $45,120 | $8,800 | $36,320 |
| 2016 | $1,004 | $45,120 | $8,800 | $36,320 |
| 2015 | -- | $45,120 | $8,800 | $36,320 |
| 2014 | -- | $45,120 | $8,800 | $36,320 |
| 2013 | -- | $45,120 | $8,800 | $36,320 |
Source: Public Records
Map
Nearby Homes
- 319 Tyson Glen Dr
- 120 Country Walk
- 109 Ashley Ct
- 101 Bay Laurel Cir
- 109 Ellice Ct
- 218 Knob Hill Dr
- 611 Broderick Cir
- 629 Broderick Cir
- 104 Bryce Dr
- 208 Northumberland Way
- 207 Broderick Cir
- 202 Gayla Ct
- 102 Stonemill Dr
- 504 Haverhill Cir
- 510 Cheshire Dr
- 208 Twelve Oaks Dr
- 121 Bridgeway Dr
- 112 Ballyhara
- 107 Sleepy Ln
- 414 Bella Notte Cir Unit 23A
- 121 Gailey Ct
- 117 Gailey Ct
- 115 Gailey Ct
- 606 Twelve Oaks Dr
- 120 Gailey Ct
- 110 Gailey Ct
- 608 Twelve Oaks Dr
- 113 Gailey Ct
- 108 Gailey Ct
- 112 Gailey Ct
- 106 Gailey Ct
- 111 Gailey Ct
- 104 Gailey Ct
- 114 Gailey Ct
- 118 Gailey Ct
- 0 Gailey Ct Unit 8824633
- 610 Twelve Oaks Dr
- 116 Gailey Ct
- 209 Melvina Dr
- 207 Melvina Dr
Your Personal Tour Guide
Ask me questions while you tour the home.