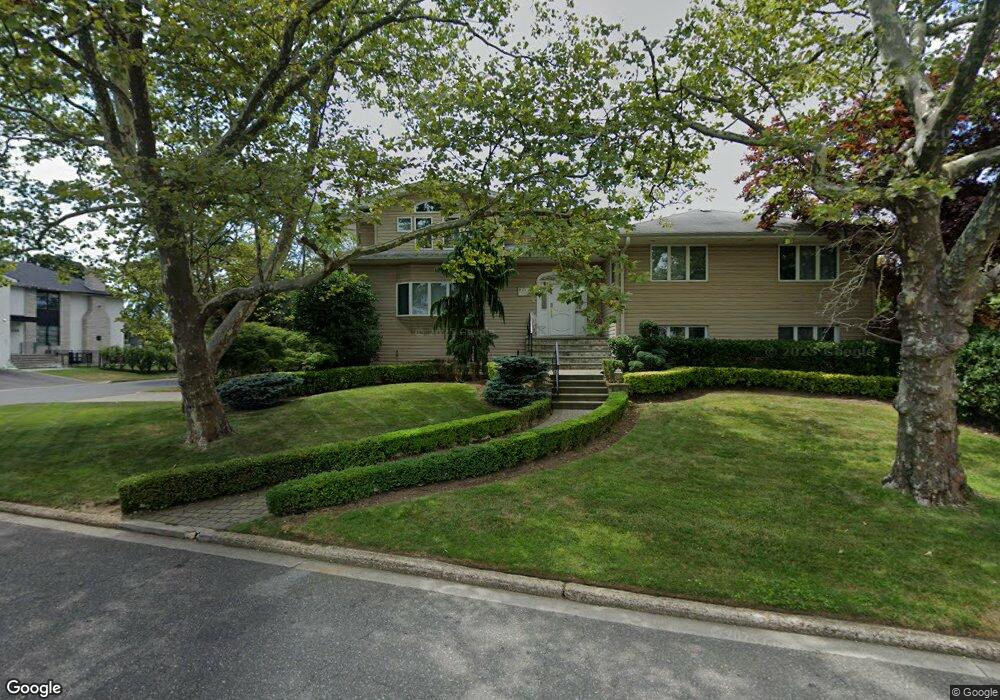
119 Harborview E Lawrence, NY 11559
Estimated Value: $2,578,938 - $3,646,000
Studio
5
Baths
4,262
Sq Ft
$730/Sq Ft
Est. Value
About This Home
This home is located at 119 Harborview E, Lawrence, NY 11559 and is currently estimated at $3,112,469, approximately $730 per square foot. 119 Harborview E is a home located in Nassau County with nearby schools including Lawrence Elementary School, Lawrence Primary School, and Lawrence Middle School.
Ownership History
Date
Name
Owned For
Owner Type
Purchase Details
Closed on
May 7, 2025
Sold by
Weissman Jack and Lwt Of Marcel Weissman
Bought by
Weissman Jack and Weissman Mark
Current Estimated Value
Home Financials for this Owner
Home Financials are based on the most recent Mortgage that was taken out on this home.
Original Mortgage
$550,000
Outstanding Balance
$547,554
Interest Rate
6.64%
Mortgage Type
New Conventional
Estimated Equity
$2,564,915
Purchase Details
Closed on
Dec 28, 2010
Sold by
Weissman Mark and Weissman Sam
Bought by
Weissman Mark and Weissman Sam
Purchase Details
Closed on
Mar 30, 2007
Sold by
Weissman Marcel
Purchase Details
Closed on
Aug 30, 2001
Sold by
Twelve Polo Realty Inc
Bought by
Weissman Marcel
Purchase Details
Closed on
Mar 9, 2001
Purchase Details
Closed on
Aug 11, 1995
Sold by
Swerdlik Richard and Swerdlik Victoria
Bought by
Swerdlik Victoria
Create a Home Valuation Report for This Property
The Home Valuation Report is an in-depth analysis detailing your home's value as well as a comparison with similar homes in the area
Home Values in the Area
Average Home Value in this Area
Purchase History
| Date | Buyer | Sale Price | Title Company |
|---|---|---|---|
| Weissman Jack | -- | Old Republic Natl Ttl Ins Co | |
| Weissman Mark | -- | -- | |
| Weissman Mark | -- | -- | |
| Weissman Mark | -- | -- | |
| -- | -- | -- | |
| -- | -- | -- | |
| Weissman Marcel | $625,000 | Mark Weissman | |
| Weissman Marcel | $625,000 | Mark Weissman | |
| -- | $646,996 | -- | |
| -- | $646,996 | -- | |
| Swerdlik Victoria | -- | -- | |
| Swerdlik Victoria | -- | -- |
Source: Public Records
Mortgage History
| Date | Status | Borrower | Loan Amount |
|---|---|---|---|
| Open | Weissman Jack | $550,000 |
Source: Public Records
Tax History
| Year | Tax Paid | Tax Assessment Tax Assessment Total Assessment is a certain percentage of the fair market value that is determined by local assessors to be the total taxable value of land and additions on the property. | Land | Improvement |
|---|---|---|---|---|
| 2025 | $19,640 | $1,350 | $624 | $726 |
| 2024 | $7,183 | $1,412 | $653 | $759 |
| 2023 | $18,863 | $1,473 | $681 | $792 |
| 2022 | $18,863 | $1,473 | $681 | $792 |
| 2021 | $22,474 | $1,601 | $740 | $861 |
| 2020 | $15,357 | $1,636 | $929 | $707 |
| 2019 | $15,949 | $1,753 | $933 | $820 |
| 2018 | $16,425 | $1,870 | $0 | $0 |
| 2017 | $11,327 | $1,987 | $940 | $1,047 |
| 2016 | $17,070 | $2,104 | $897 | $1,207 |
| 2015 | $5,970 | $2,221 | $817 | $1,404 |
| 2014 | $5,970 | $2,221 | $817 | $1,404 |
| 2013 | $5,791 | $2,335 | $859 | $1,476 |
Source: Public Records
Map
Nearby Homes
- 156 Harborview S
- 150 Lakeside Dr S
- 74 Margaret Ave
- 178 Wildacre Ave
- 233 Narragansett Ave
- 261 Central Ave Unit A-4
- 261 Central Ave Unit E4
- 180 Longwood Crossing
- 260 Central Ave Unit 135
- 260 Central Ave Unit 430
- 24 Beechwood Dr
- 345 Broadway
- 130 Hards Ln
- 240 Central Ave Unit 2 F
- 230 Central Ave Unit 1-F
- 230 Central Ave Unit 1C
- 285 Central Ave Unit D-7
- 285 Central Ave Unit B-4
- 285 Central Ave Unit D6
- 365 Broadway
- 222 Harborview N
- 225 Harborview N
- 216 Harborview N
- 116 Harborview E
- 124 Harborview E
- 229 Juniper Cir S
- 227 Juniper Cir S
- 233 Juniper Cir E
- 217 Harborview N
- 223 Juniper Cir S
- 128 Harborview E
- 131 Harborview E
- 210 Harborview N
- 231 Juniper Cir E
- 219 Juniper Cir S
- 132 Harborview E
- 211 Harborview N
- 217 Juniper Cir S
- 235 Juniper Cir E
Your Personal Tour Guide
Ask me questions while you tour the home.