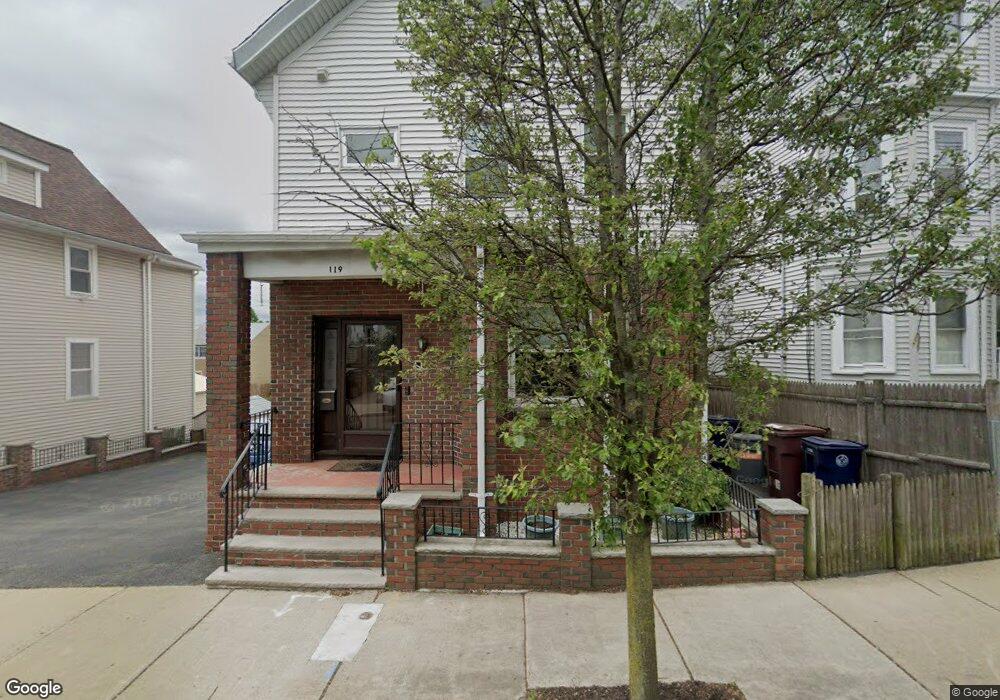
119 High St Everett, MA 02149
Glendale NeighborhoodEstimated Value: $834,000 - $913,000
4
Beds
3
Baths
2,750
Sq Ft
$317/Sq Ft
Est. Value
About This Home
This home is located at 119 High St, Everett, MA 02149 and is currently estimated at $871,418, approximately $316 per square foot. 119 High St is a home located in Middlesex County with nearby schools including Everett High School, Pioneer Charter School of Science, and St Anthony School.
Ownership History
Date
Name
Owned For
Owner Type
Purchase Details
Closed on
Dec 4, 2019
Sold by
Farina Michelle and Farina Richard
Bought by
Farina Michelle
Current Estimated Value
Purchase Details
Closed on
Jul 7, 2014
Sold by
Martinelli Peter R and Martinelli Elizabeth
Bought by
Farina Michelle and Farina Richard
Purchase Details
Closed on
Sep 6, 2007
Sold by
Martinelli Elizabeth and Martinelli Peter R
Bought by
Martinelli Elizabeth and Farina Michele
Create a Home Valuation Report for This Property
The Home Valuation Report is an in-depth analysis detailing your home's value as well as a comparison with similar homes in the area
Home Values in the Area
Average Home Value in this Area
Purchase History
| Date | Buyer | Sale Price | Title Company |
|---|---|---|---|
| Farina Michelle | -- | None Available | |
| Farina Michelle | -- | -- | |
| Martinelli Elizabeth | -- | -- |
Source: Public Records
Tax History
| Year | Tax Paid | Tax Assessment Tax Assessment Total Assessment is a certain percentage of the fair market value that is determined by local assessors to be the total taxable value of land and additions on the property. | Land | Improvement |
|---|---|---|---|---|
| 2025 | $8,902 | $781,600 | $257,400 | $524,200 |
| 2024 | $8,210 | $716,400 | $235,300 | $481,100 |
| 2023 | $8,003 | $679,400 | $225,500 | $453,900 |
| 2022 | $6,476 | $625,100 | $205,900 | $419,200 |
| 2021 | $5,586 | $566,000 | $174,000 | $392,000 |
| 2020 | $5,690 | $534,800 | $174,000 | $360,800 |
| 2019 | $5,994 | $484,200 | $162,300 | $321,900 |
| 2018 | $5,803 | $421,100 | $141,200 | $279,900 |
| 2017 | $5,243 | $363,100 | $107,800 | $255,300 |
| 2016 | $5,088 | $352,100 | $107,100 | $245,000 |
| 2015 | $4,767 | $326,300 | $93,100 | $233,200 |
Source: Public Records
Map
Nearby Homes
- 105 Summer St
- 110 Ferry St
- 121 Cottage St
- 37 Argyle St
- 20 Ferry St Unit B
- 20 Derne St
- 56 Mansfield St
- 11 Hampshire St
- 7 Hampshire St
- 148 Florence St
- 181 Chelsea St
- 40 Baker Rd
- 18 Winter St
- 30 Chelsea St Unit 210
- 238 Chelsea St
- 114 Francis St
- 44-46 Cabot St
- 55 Garland St
- 12 Hamilton St Unit 8
- 15 Waverly Ave
- 123 High St
- 123 High St Unit 2
- 123 High St
- 123 High St Unit 2
- 123 High St Unit 1
- 123 High St Unit 1
- 115 High St
- 113 High St
- 27 Auburn St
- 127 High St
- 111 High St
- 109-111 High St Unit 1
- 109 High St Unit 1
- 29 Auburn St Unit 2L
- 29 Auburn St Unit 1L
- 29 Auburn St
- 21 Auburn St
- 120 High St
- 124 High St
- 131 High St
Your Personal Tour Guide
Ask me questions while you tour the home.