Estimated Value: $222,821 - $274,000
--
Bed
--
Bath
1,736
Sq Ft
$146/Sq Ft
Est. Value
About This Home
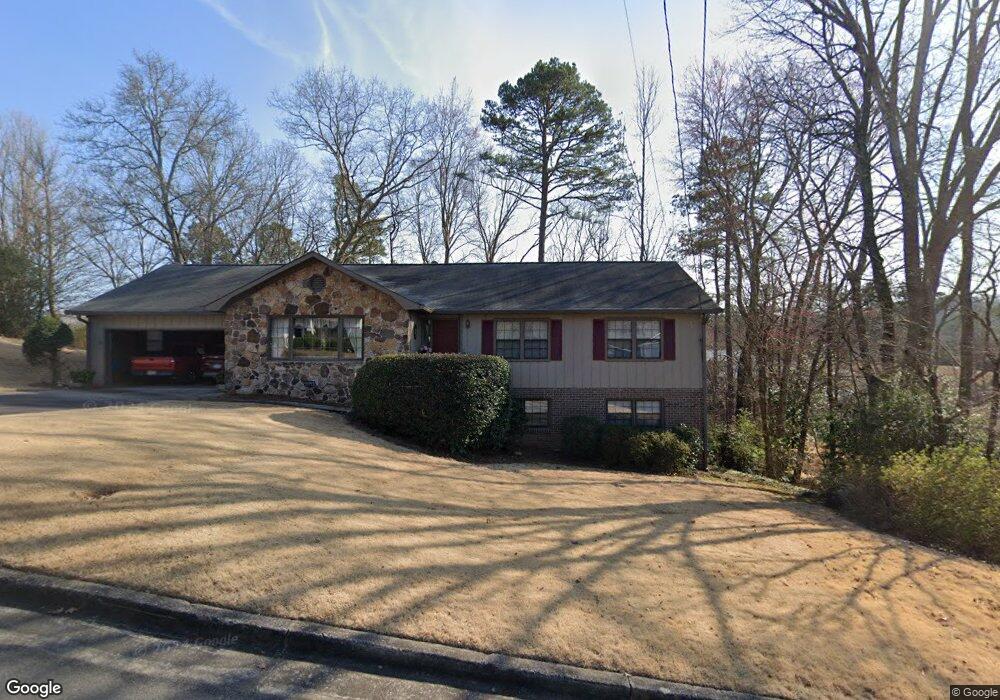
This home is located at 119 Hycliff Rd SW, Rome, GA 30165 and is currently estimated at $252,705, approximately $145 per square foot. 119 Hycliff Rd SW is a home located in Floyd County with nearby schools including Rome High School.
Ownership History
Date
Name
Owned For
Owner Type
Purchase Details
Closed on
Nov 25, 1988
Sold by
Cunningham Gladys P
Bought by
Hopper Loy N and Hopper Sue S
Current Estimated Value
Purchase Details
Closed on
May 1, 1979
Sold by
Brooks O J
Bought by
Cunningham Gladys P
Purchase Details
Closed on
Jan 12, 1978
Sold by
Davis Clyde R Bldrs
Bought by
Brooks O J
Purchase Details
Closed on
Mar 26, 1970
Bought by
Davis Clyde R Bldrs
Create a Home Valuation Report for This Property
The Home Valuation Report is an in-depth analysis detailing your home's value as well as a comparison with similar homes in the area
Home Values in the Area
Average Home Value in this Area
Purchase History
| Date | Buyer | Sale Price | Title Company |
|---|---|---|---|
| Hopper Loy N | $76,000 | -- | |
| Cunningham Gladys P | $56,900 | -- | |
| Brooks O J | $50,000 | -- | |
| Davis Clyde R Bldrs | -- | -- |
Source: Public Records
Tax History Compared to Growth
Tax History
| Year | Tax Paid | Tax Assessment Tax Assessment Total Assessment is a certain percentage of the fair market value that is determined by local assessors to be the total taxable value of land and additions on the property. | Land | Improvement |
|---|---|---|---|---|
| 2024 | $1,468 | $85,219 | $11,904 | $73,315 |
| 2023 | $1,398 | $82,333 | $10,752 | $71,581 |
| 2022 | $1,065 | $59,982 | $8,832 | $51,150 |
| 2021 | $1,007 | $55,528 | $8,832 | $46,696 |
| 2020 | $948 | $51,526 | $6,720 | $44,806 |
| 2019 | $899 | $49,514 | $6,720 | $42,794 |
| 2018 | $862 | $47,413 | $6,720 | $40,693 |
| 2017 | $819 | $44,933 | $6,720 | $38,213 |
| 2016 | $814 | $44,400 | $6,720 | $37,680 |
| 2015 | $775 | $44,960 | $6,720 | $38,240 |
| 2014 | $775 | $46,974 | $6,720 | $40,254 |
Source: Public Records
Map
Nearby Homes
- 203 Hycliff Rd SW
- 2 Thornwood Dr SW
- 121 Kenwood Dr SW
- 106 Kenwood Dr SW
- 8 Bush Arbor Place SW
- 10 Bush Arbor Place SW
- 120 Thornwood Dr SW
- 125 Thornwood Dr SW
- 130 Thornwood Dr SW
- 23 Bush Arbor Place SW
- 15 Ladonna Place SW
- 30 Westover Dr SW
- The Foxcroft Plan at North Haven
- The Benson II Plan at North Haven
- The Coleman Plan at North Haven
- The Bradley Plan at North Haven
- The McGinnis Plan at North Haven
- The Pearson Plan at North Haven
- The Caldwell Plan at North Haven
- The Grayson Plan at North Haven
- 117 Hycliff Rd SW Unit 12
- 117 Hycliff Rd SW
- 16 Thornwood Dr SW
- 3 Elmwood Dr SW
- 14 Thornwood Dr SW
- 115 Hycliff Rd SW
- 120 Hycliff Rd SW
- 122 Hycliff Rd SW
- 118 Hycliff Rd SW
- 118 Hycliff Rd SW Unit 40
- 12 Thornwood Dr SW
- 124 Hycliff Rd SW Unit 43
- 124 Hycliff Rd SW
- 201 Hycliff Rd SW Unit 37
- 201 Hycliff Rd SW
- 100 Thornwood Dr SW
- 116 Hycliff Rd SW
- 9 Thornwood Dr SW
- 113 Hycliff Rd SW
- 11 Fernwood Dr SW