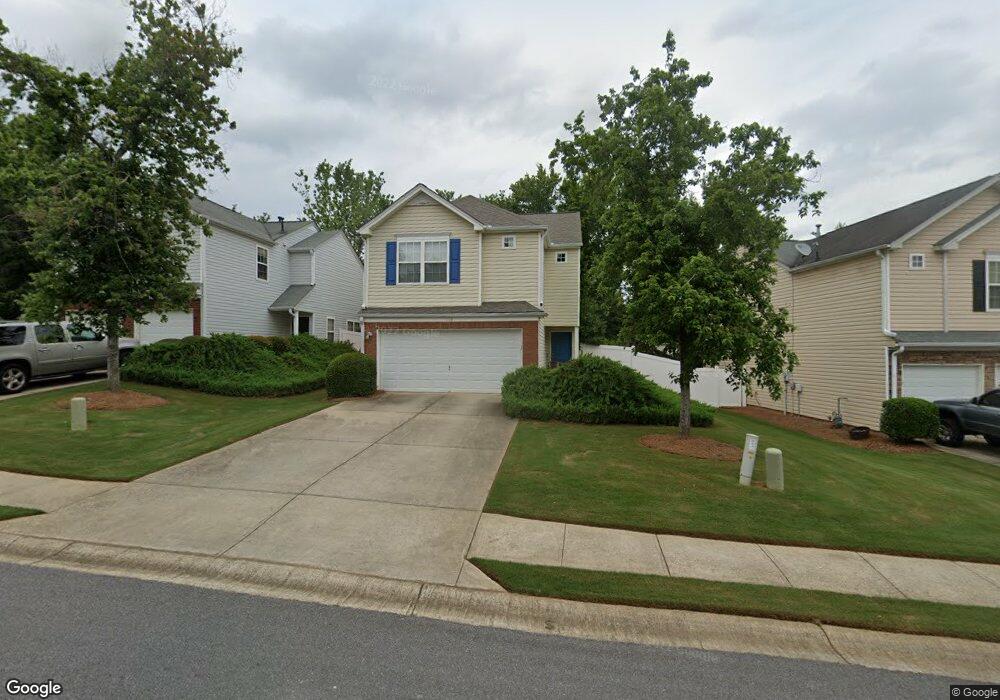
119 Ilex Dr Canton, GA 30114
Estimated Value: $314,000 - $323,003
3
Beds
3
Baths
1,287
Sq Ft
$247/Sq Ft
Est. Value
About This Home
This home is located at 119 Ilex Dr, Canton, GA 30114 and is currently estimated at $318,502, approximately $247 per square foot. 119 Ilex Dr is a home located in Cherokee County with nearby schools including Liberty Elementary School, Freedom Middle School, and Cherokee High School.
Ownership History
Date
Name
Owned For
Owner Type
Purchase Details
Closed on
Jul 15, 2020
Sold by
Hingsbergen Todd
Bought by
Castleberry Tracy
Current Estimated Value
Home Financials for this Owner
Home Financials are based on the most recent Mortgage that was taken out on this home.
Original Mortgage
$198,341
Outstanding Balance
$175,483
Interest Rate
3.1%
Mortgage Type
FHA
Estimated Equity
$143,019
Purchase Details
Closed on
Nov 17, 2005
Sold by
Moulton Addie G
Bought by
Hingsbergen Todd
Home Financials for this Owner
Home Financials are based on the most recent Mortgage that was taken out on this home.
Original Mortgage
$111,920
Interest Rate
6.85%
Mortgage Type
New Conventional
Purchase Details
Closed on
Aug 13, 2002
Sold by
Colony Homes Llc
Bought by
Snead Addie G
Home Financials for this Owner
Home Financials are based on the most recent Mortgage that was taken out on this home.
Original Mortgage
$118,164
Interest Rate
6.49%
Mortgage Type
FHA
Create a Home Valuation Report for This Property
The Home Valuation Report is an in-depth analysis detailing your home's value as well as a comparison with similar homes in the area
Home Values in the Area
Average Home Value in this Area
Purchase History
| Date | Buyer | Sale Price | Title Company |
|---|---|---|---|
| Castleberry Tracy | $202,000 | -- | |
| Hingsbergen Todd | $139,900 | -- | |
| Snead Addie G | $119,100 | -- |
Source: Public Records
Mortgage History
| Date | Status | Borrower | Loan Amount |
|---|---|---|---|
| Open | Castleberry Tracy | $198,341 | |
| Previous Owner | Hingsbergen Todd | $111,920 | |
| Previous Owner | Snead Addie G | $118,164 |
Source: Public Records
Tax History
| Year | Tax Paid | Tax Assessment Tax Assessment Total Assessment is a certain percentage of the fair market value that is determined by local assessors to be the total taxable value of land and additions on the property. | Land | Improvement |
|---|---|---|---|---|
| 2025 | $3,299 | $126,376 | $26,000 | $100,376 |
| 2024 | $3,239 | $123,524 | $26,000 | $97,524 |
| 2023 | $2,898 | $129,512 | $26,000 | $103,512 |
| 2022 | $2,595 | $96,064 | $18,360 | $77,704 |
| 2021 | $2,373 | $80,800 | $17,703 | $63,097 |
| 2020 | $2,297 | $75,240 | $16,400 | $58,840 |
| 2019 | $2,018 | $66,080 | $14,400 | $51,680 |
| 2018 | $1,844 | $60,040 | $12,800 | $47,240 |
| 2017 | $1,339 | $139,900 | $12,000 | $43,960 |
| 2016 | $1,339 | $130,100 | $9,600 | $42,440 |
| 2015 | $1,274 | $122,700 | $9,600 | $39,480 |
| 2014 | $1,516 | $117,600 | $9,600 | $37,440 |
Source: Public Records
Map
Nearby Homes
- 190 Ilex Dr
- 188 Ilex Dr
- 349 Nobleman Way
- 304 Meadows Ln Unit 2
- 107 Nacoochee Way
- 312 Woodland Pass
- 150 Hidden Lake Cir
- 116 Hidden Lake Cir
- 151 Prominence Ct
- 729 Mountain Laurel Dr
- 288 Valley Crossing
- 311 Nobleman Way
- 2240 Mills Wood Run Unit 3
- 350 Meadows Ln
- 151 Spring Way Square
- 234 Winterbury Dr
- 103 Prominence Ct
- 2215 Mills Wood Run
- 230 Valley Crossing
- 922 Gardenia Curve
Your Personal Tour Guide
Ask me questions while you tour the home.