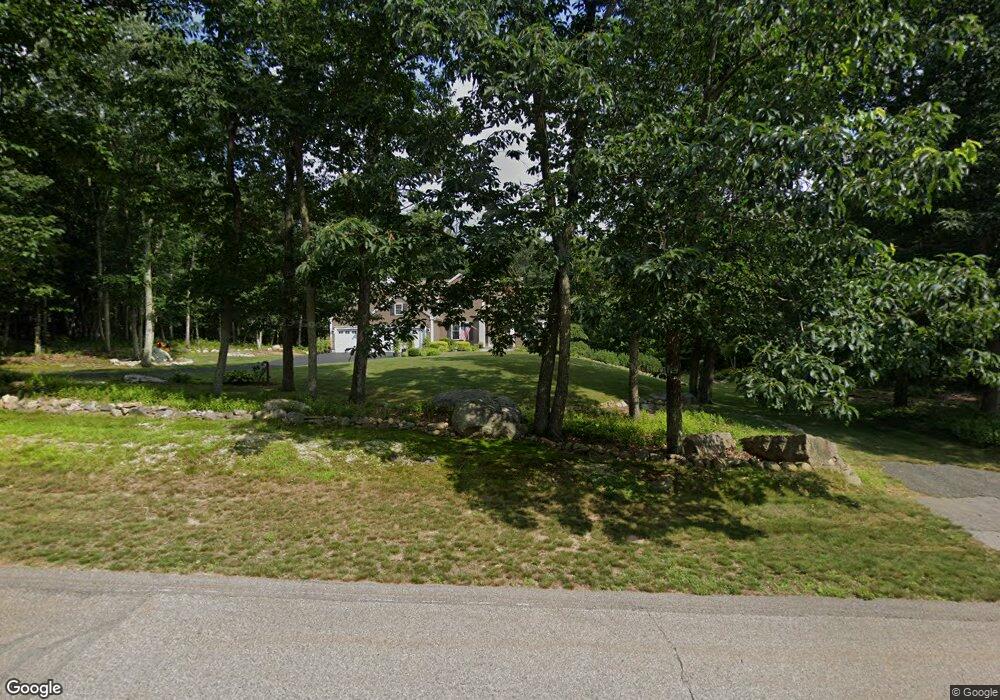
119 Kasey Ct Uxbridge, MA 01569
Estimated Value: $755,000 - $798,000
4
Beds
3
Baths
2,519
Sq Ft
$306/Sq Ft
Est. Value
About This Home
This home is located at 119 Kasey Ct, Uxbridge, MA 01569 and is currently estimated at $770,529, approximately $305 per square foot. 119 Kasey Ct is a home with nearby schools including Uxbridge High School.
Ownership History
Date
Name
Owned For
Owner Type
Purchase Details
Closed on
Mar 25, 2013
Sold by
Recore Omer H and Recore Elaine F
Bought by
O H Jr&E F Recore Ret and Recore Omer H
Current Estimated Value
Purchase Details
Closed on
Jul 22, 2010
Sold by
Benoit Stephen P and Benoit Linda A
Bought by
Recore Omer H and Recore Elaine F
Home Financials for this Owner
Home Financials are based on the most recent Mortgage that was taken out on this home.
Original Mortgage
$348,000
Interest Rate
4.76%
Mortgage Type
Purchase Money Mortgage
Create a Home Valuation Report for This Property
The Home Valuation Report is an in-depth analysis detailing your home's value as well as a comparison with similar homes in the area
Home Values in the Area
Average Home Value in this Area
Purchase History
| Date | Buyer | Sale Price | Title Company |
|---|---|---|---|
| O H Jr&E F Recore Ret | -- | -- | |
| Recore Omer H | $150,000 | -- |
Source: Public Records
Mortgage History
| Date | Status | Borrower | Loan Amount |
|---|---|---|---|
| Previous Owner | Recore Omer H | $348,000 |
Source: Public Records
Tax History Compared to Growth
Tax History
| Year | Tax Paid | Tax Assessment Tax Assessment Total Assessment is a certain percentage of the fair market value that is determined by local assessors to be the total taxable value of land and additions on the property. | Land | Improvement |
|---|---|---|---|---|
| 2025 | $91 | $690,900 | $170,000 | $520,900 |
| 2024 | $8,584 | $664,400 | $161,300 | $503,100 |
| 2023 | $8,205 | $588,200 | $139,500 | $448,700 |
| 2022 | $7,083 | $467,200 | $122,100 | $345,100 |
| 2021 | $7,391 | $467,200 | $122,100 | $345,100 |
| 2020 | $7,896 | $471,700 | $130,800 | $340,900 |
| 2019 | $8,016 | $462,000 | $143,800 | $318,200 |
| 2018 | $7,802 | $454,400 | $143,800 | $310,600 |
| 2017 | $7,561 | $445,800 | $129,300 | $316,500 |
| 2016 | $7,784 | $443,000 | $113,000 | $330,000 |
| 2015 | $7,579 | $435,600 | $113,000 | $322,600 |
Source: Public Records
Map
Nearby Homes
- 29 Glendale St
- 36 Clark Rd
- 239 Aldrich St
- 215 Chestnut St
- 15 Turner Farm Rd
- 12 Turner Farm Rd
- 18 Turner Farm Rd
- 139 Turner Farm Rd
- 46 Turner Farm Rd
- 45 Turner Farm Rd
- 127 Turner Farm Rd
- 117 Turner Farm Rd
- 70 Chocolog Rd
- 13 Perry St
- 9 Balm of Life Spring Rd
- 307 S East Main St Unit Lot 9
- 303 S East Main St Unit Lot 8
- 299 S East Main St Unit Lot 7
- 104 Eber Taft Rd
- 295 S East Main St Unit Lot 6