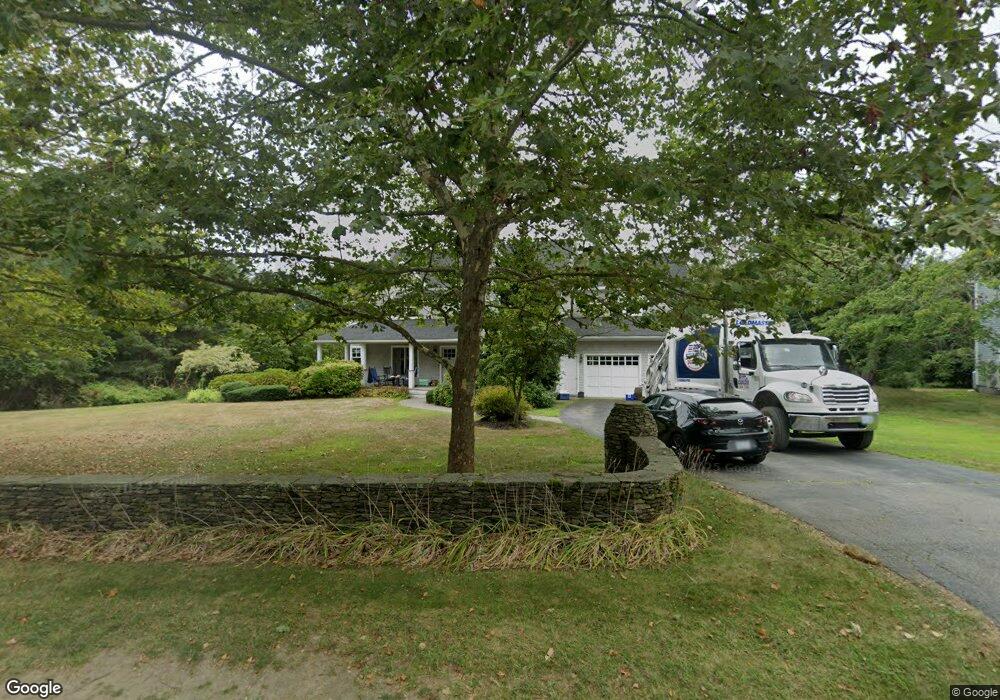
119 Kettle Pond Dr Wakefield, RI 02879
Estimated Value: $1,074,000 - $1,504,000
4
Beds
4
Baths
4,632
Sq Ft
$290/Sq Ft
Est. Value
About This Home
This home is located at 119 Kettle Pond Dr, Wakefield, RI 02879 and is currently estimated at $1,344,217, approximately $290 per square foot. 119 Kettle Pond Dr is a home located in Washington County with nearby schools including South Kingstown High School and South Shore School.
Ownership History
Date
Name
Owned For
Owner Type
Purchase Details
Closed on
Jan 5, 2021
Sold by
Leonard Matthew J and Leonard Jeanmarie
Bought by
Leonard Jack
Current Estimated Value
Home Financials for this Owner
Home Financials are based on the most recent Mortgage that was taken out on this home.
Original Mortgage
$457,000
Outstanding Balance
$407,874
Interest Rate
2.71%
Mortgage Type
Stand Alone Refi Refinance Of Original Loan
Estimated Equity
$1,009,386
Purchase Details
Closed on
Feb 28, 2020
Sold by
Leonard Matthew J and Leonard Jeanmarie
Bought by
Leonard Matthew J and Leonard Jeanmarie
Home Financials for this Owner
Home Financials are based on the most recent Mortgage that was taken out on this home.
Original Mortgage
$450,000
Interest Rate
3.5%
Mortgage Type
New Conventional
Purchase Details
Closed on
Sep 29, 1995
Sold by
Randall Jared P and Randall Deborah
Bought by
Leonard Matthew J and Leonard Jean
Create a Home Valuation Report for This Property
The Home Valuation Report is an in-depth analysis detailing your home's value as well as a comparison with similar homes in the area
Home Values in the Area
Average Home Value in this Area
Purchase History
| Date | Buyer | Sale Price | Title Company |
|---|---|---|---|
| Leonard Jack | -- | None Available | |
| Leonard Matthew J | -- | None Available | |
| Leonard Matthew J | $66,000 | -- |
Source: Public Records
Mortgage History
| Date | Status | Borrower | Loan Amount |
|---|---|---|---|
| Open | Leonard Jack | $457,000 | |
| Previous Owner | Leonard Matthew J | $450,000 | |
| Previous Owner | Leonard Matthew J | $390,000 | |
| Previous Owner | Leonard Matthew J | $400,000 | |
| Previous Owner | Leonard Matthew J | $475,000 |
Source: Public Records
Tax History Compared to Growth
Tax History
| Year | Tax Paid | Tax Assessment Tax Assessment Total Assessment is a certain percentage of the fair market value that is determined by local assessors to be the total taxable value of land and additions on the property. | Land | Improvement |
|---|---|---|---|---|
| 2025 | $11,028 | $1,233,600 | $301,500 | $932,100 |
| 2024 | $10,919 | $988,100 | $252,300 | $735,800 |
| 2023 | $10,919 | $988,100 | $252,300 | $735,800 |
| 2022 | $10,820 | $988,100 | $252,300 | $735,800 |
| 2021 | $9,826 | $680,000 | $159,900 | $520,100 |
| 2020 | $9,826 | $680,000 | $159,900 | $520,100 |
| 2019 | $9,826 | $680,000 | $159,900 | $520,100 |
| 2018 | $9,087 | $579,500 | $148,100 | $431,400 |
| 2017 | $8,872 | $579,500 | $148,100 | $431,400 |
| 2016 | $8,745 | $579,500 | $148,100 | $431,400 |
| 2015 | $8,274 | $533,100 | $134,800 | $398,300 |
| 2014 | $8,252 | $533,100 | $134,800 | $398,300 |
Source: Public Records
Map
Nearby Homes
- 2139 Commodore Oliver Hazard Perry Hwy
- 380 Camp Fuller Rd
- 16 High Tides Ln
- 83 Gooseberry Rd
- 17 Westside Rd
- 1591 Commodore Perry Hwy
- 392 Gooseberry Rd
- 689 Succotash Rd
- 691 Succotash Rd
- 14 E Pointe Ct Unit 14
- 277 Prospect Rd
- 20 Marine Dr
- 25 Scallop Shell Rd
- 37 Spartina Cove Way
- 17 Goose Island Rd
- 62 Spartina Cove Way
- 100 Spartina Cove Way
- 2321 Post Rd
- 6 MacAlder St
- 770 Tuckertown Rd
- 111 Kettle Pond Dr
- 99 Kettle Pond Dr
- 102 Kettle Pond Dr
- 2 Mast Ct
- 140 Kettle Pond Dr
- 87 Kettle Pond Dr
- 1280 Post Rd
- 1302 Post Rd
- 10 Mast Ct
- 173 Kettle Pond Dr
- 74 Kettle Pond Dr
- 75 Kettle Pond Dr
- 186 Kettle Pond Dr
- 185 Kettle Pond Dr
- 61 Kettle Pond Dr
- 193 Kettle Pond Dr
- 1270 Post Rd
- 1314 Post Rd
- 204 Kettle Pond Dr
- 37 Kettle Pond Dr