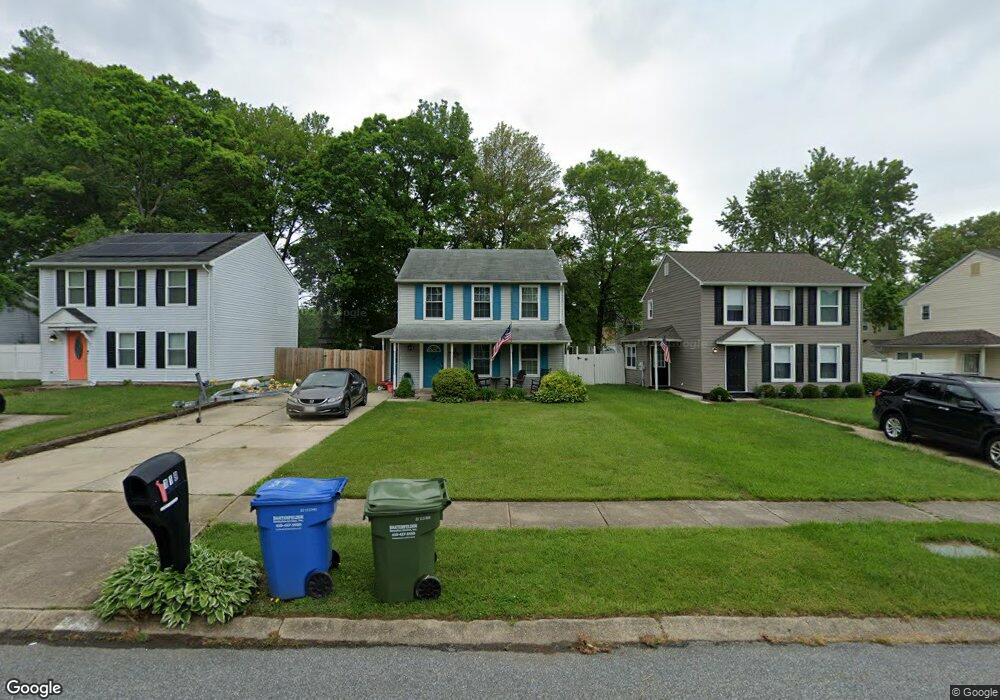
119 Laburnum Rd Edgewood, MD 21040
Estimated Value: $267,000 - $294,000
Studio
2
Baths
1,304
Sq Ft
$212/Sq Ft
Est. Value
About This Home
This home is located at 119 Laburnum Rd, Edgewood, MD 21040 and is currently estimated at $277,010, approximately $212 per square foot. 119 Laburnum Rd is a home located in Harford County with nearby schools including Deerfield Elementary School, Edgewood Middle School, and Edgewood High School.
Ownership History
Date
Name
Owned For
Owner Type
Purchase Details
Closed on
May 9, 2022
Sold by
Keifer Mark J
Bought by
Keifer Brent J and Downes Amber M
Current Estimated Value
Home Financials for this Owner
Home Financials are based on the most recent Mortgage that was taken out on this home.
Original Mortgage
$216,015
Outstanding Balance
$205,246
Interest Rate
5.27%
Mortgage Type
FHA
Estimated Equity
$71,764
Purchase Details
Closed on
May 15, 1998
Sold by
Kiefer Mark J
Bought by
Kiefer Mark J and Kiefer Jill L
Purchase Details
Closed on
Aug 4, 1983
Sold by
Chesapeake Homes Inc
Bought by
Minacapelli Karl-Heinz Alfred
Home Financials for this Owner
Home Financials are based on the most recent Mortgage that was taken out on this home.
Original Mortgage
$59,900
Interest Rate
13.65%
Create a Home Valuation Report for This Property
The Home Valuation Report is an in-depth analysis detailing your home's value as well as a comparison with similar homes in the area
Home Values in the Area
Average Home Value in this Area
Purchase History
| Date | Buyer | Sale Price | Title Company |
|---|---|---|---|
| Keifer Brent J | $220,000 | None Listed On Document | |
| Kiefer Mark J | -- | -- | |
| Minacapelli Karl-Heinz Alfred | $61,200 | -- |
Source: Public Records
Mortgage History
| Date | Status | Borrower | Loan Amount |
|---|---|---|---|
| Open | Keifer Brent J | $216,015 | |
| Previous Owner | Minacapelli Karl-Heinz Alfred | $59,900 | |
| Closed | Kiefer Mark J | -- |
Source: Public Records
Tax History
| Year | Tax Paid | Tax Assessment Tax Assessment Total Assessment is a certain percentage of the fair market value that is determined by local assessors to be the total taxable value of land and additions on the property. | Land | Improvement |
|---|---|---|---|---|
| 2025 | $2,029 | $200,533 | $0 | $0 |
| 2024 | $2,029 | $186,167 | $0 | $0 |
| 2023 | $1,872 | $171,800 | $50,100 | $121,700 |
| 2022 | $1,821 | $167,033 | $0 | $0 |
| 2021 | $3,611 | $162,267 | $0 | $0 |
| 2020 | $1,730 | $157,500 | $50,100 | $107,400 |
| 2019 | $1,645 | $147,933 | $0 | $0 |
| 2018 | $1,597 | $138,367 | $0 | $0 |
| 2017 | $1,473 | $128,800 | $0 | $0 |
| 2016 | -- | $128,800 | $0 | $0 |
| 2015 | $1,799 | $128,800 | $0 | $0 |
| 2014 | $1,799 | $135,600 | $0 | $0 |
Source: Public Records
Map
Nearby Homes
- 2961 Siwanoy Dr
- 308 Laburnum Rd
- 2935 Ancon Ct
- 303 Lord Willoughby Way
- 606 Harbour Oak Dr
- 3151 Ebbtide Dr
- 408 Bauers Dr
- 304 Canoe Ln
- 501 Arbor Ct
- 2613 Thornberry Dr
- 730 Sequoia Dr
- 3901 Walters Rd
- 3905 Love Ave
- 503 Catalpa Ln
- 3913 Love Ct
- 62 Little Creek Ln
- 1071 Sand Pebble Dr
- 750 Harford Boat Club Rd
- 2707 Pulaski Hwy
- 2115 Nuttal Ave
- 117 Laburnum Rd
- 121 Laburnum Rd
- 115 Laburnum Rd
- 123 Laburnum Rd
- 110 Palmetto Dr
- 112 Palmetto Dr
- 113 Laburnum Rd
- 125 Laburnum Rd
- 108 Palmetto Dr
- 114 Palmetto Dr
- 106 Palmetto Dr
- 116 Palmetto Dr
- 128 Laburnum Rd
- 130 Laburnum Rd
- 104 Palmetto Dr
- 118 Palmetto Dr
- 111 Laburnum Rd
- 132 Laburnum Rd
- 124 Laburnum Rd
- 127 Laburnum Rd
Your Personal Tour Guide
Ask me questions while you tour the home.