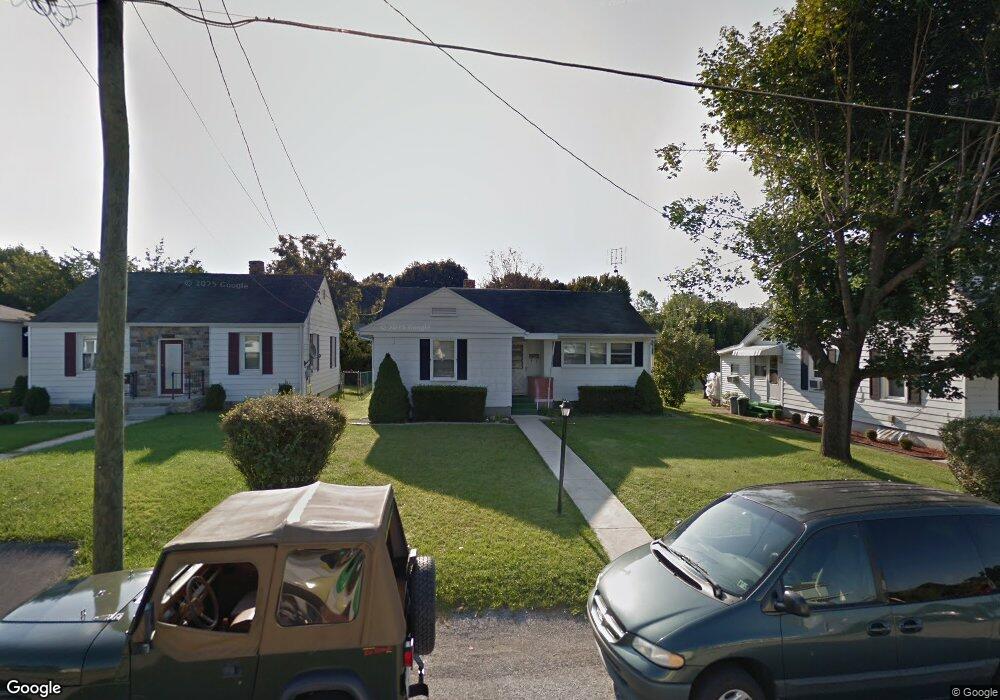
119 Landis Ave Waynesboro, PA 17268
Estimated Value: $140,500 - $240,000
3
Beds
2
Baths
1,225
Sq Ft
$149/Sq Ft
Est. Value
About This Home
This home is located at 119 Landis Ave, Waynesboro, PA 17268 and is currently estimated at $182,125, approximately $148 per square foot. 119 Landis Ave is a home located in Franklin County with nearby schools including Waynesboro Area Senior High School, St. Andrew Catholic School, and Noah's Ark Christian Child Care Center.
Ownership History
Date
Name
Owned For
Owner Type
Purchase Details
Closed on
Jul 31, 2024
Sold by
Lesher Gabriel R and Lesher Norma G
Bought by
Sprenkle Joshua W
Current Estimated Value
Home Financials for this Owner
Home Financials are based on the most recent Mortgage that was taken out on this home.
Original Mortgage
$113,400
Outstanding Balance
$112,117
Interest Rate
6.87%
Mortgage Type
New Conventional
Estimated Equity
$70,008
Purchase Details
Closed on
Nov 16, 2010
Sold by
Binkley Myrna Fry and Moats Goldie Jean
Bought by
Lesher Gabriel R
Home Financials for this Owner
Home Financials are based on the most recent Mortgage that was taken out on this home.
Original Mortgage
$124,248
Interest Rate
4.22%
Mortgage Type
New Conventional
Create a Home Valuation Report for This Property
The Home Valuation Report is an in-depth analysis detailing your home's value as well as a comparison with similar homes in the area
Home Values in the Area
Average Home Value in this Area
Purchase History
| Date | Buyer | Sale Price | Title Company |
|---|---|---|---|
| Sprenkle Joshua W | $126,000 | Buchanan Settlement Services | |
| Lesher Gabriel R | $119,900 | None Available |
Source: Public Records
Mortgage History
| Date | Status | Borrower | Loan Amount |
|---|---|---|---|
| Open | Sprenkle Joshua W | $113,400 | |
| Previous Owner | Lesher Gabriel R | $124,248 |
Source: Public Records
Tax History Compared to Growth
Tax History
| Year | Tax Paid | Tax Assessment Tax Assessment Total Assessment is a certain percentage of the fair market value that is determined by local assessors to be the total taxable value of land and additions on the property. | Land | Improvement |
|---|---|---|---|---|
| 2025 | $1,719 | $11,190 | $580 | $10,610 |
| 2024 | $1,669 | $11,190 | $580 | $10,610 |
| 2023 | $1,619 | $11,190 | $580 | $10,610 |
| 2022 | $1,571 | $11,190 | $580 | $10,610 |
| 2021 | $1,527 | $11,190 | $580 | $10,610 |
| 2020 | $1,503 | $11,190 | $580 | $10,610 |
| 2019 | $1,469 | $11,190 | $580 | $10,610 |
| 2018 | $1,422 | $11,190 | $580 | $10,610 |
| 2017 | $1,391 | $11,190 | $580 | $10,610 |
| 2016 | $321 | $11,190 | $580 | $10,610 |
| 2015 | $299 | $11,190 | $580 | $10,610 |
| 2014 | $299 | $11,190 | $580 | $10,610 |
Source: Public Records
Map
Nearby Homes
- 13082 Welty Rd
- 162 Briar Ridge Dr
- 45 Eastland Cir
- 13189 Seneca Dr
- 11439 Viking Ave
- 12398 Shelby Ave
- 10828 Buchanan Trail E
- 9383 Oyer Dr
- 539 Abigail Ave
- 535 Abigail Ave
- 500 Abigail Ave
- 508 Abigail Ave
- 506 Abigail Ave
- 504 Abigail Ave
- 512 Abigail Ave
- 533 Abigail Ave
- 516 Abigail Ave
- 11704 Country Club Rd
- 504 Iverson Rd
- 502 Iverson Rd
- 123 Landis Ave
- 115 Landis Ave
- 111 Landis Ave
- 205 Landis Ave
- 120 S Oller Ave
- 114 S Oller Ave
- 109 Landis Ave
- 118 Landis Ave
- 122 Landis Ave
- 104 S Oller Ave
- 110 Landis Ave
- 204 S Oller Ave
- 101 Landis Ave
- 211 Landis Ave
- 96 Landis Ave
- 204 Landis Ave
- 0 Lot 107 N Landis Ave Unit 1001022451
- 104 Landis Ave
- 1822 Highland Terrace
- 210 S Oller Ave