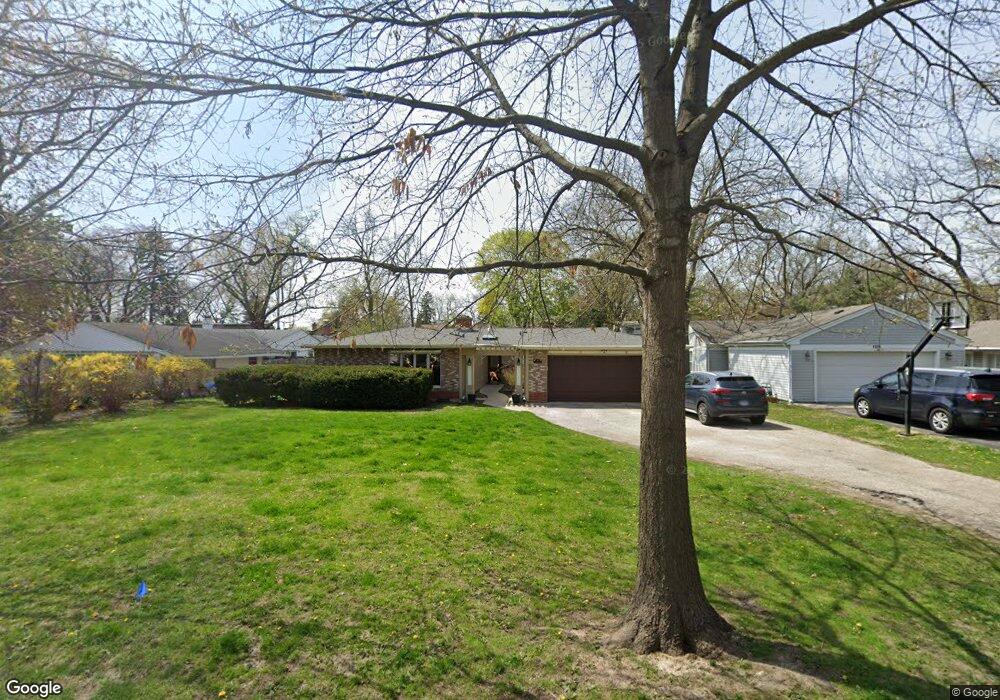
119 Lockerbie Ln Wilmette, IL 60091
Estimated Value: $557,000 - $769,000
4
Beds
3
Baths
1,888
Sq Ft
$344/Sq Ft
Est. Value
About This Home
This home is located at 119 Lockerbie Ln, Wilmette, IL 60091 and is currently estimated at $649,968, approximately $344 per square foot. 119 Lockerbie Ln is a home located in Cook County with nearby schools including Romona Elementary School, Highcrest Middle School, and Wilmette Junior High School.
Ownership History
Date
Name
Owned For
Owner Type
Purchase Details
Closed on
Jan 8, 2008
Sold by
Drwiega Chester and Drwiega Czeslaw
Bought by
Drwiega Helena E and Drwiega Luiza A
Current Estimated Value
Purchase Details
Closed on
Apr 20, 2000
Sold by
Drwiega Czeslaw and Drwiega Helena
Bought by
Drwiega Chester
Home Financials for this Owner
Home Financials are based on the most recent Mortgage that was taken out on this home.
Original Mortgage
$191,000
Interest Rate
8.24%
Purchase Details
Closed on
Aug 24, 1998
Sold by
World S & L Assn Fsla
Bought by
Drwiega Czeslaw and Drwiega Helena
Home Financials for this Owner
Home Financials are based on the most recent Mortgage that was taken out on this home.
Original Mortgage
$188,000
Interest Rate
6.72%
Purchase Details
Closed on
May 29, 1998
Sold by
Chang Wow Kuk and Chang Diana Kim
Bought by
World S & L Assn
Create a Home Valuation Report for This Property
The Home Valuation Report is an in-depth analysis detailing your home's value as well as a comparison with similar homes in the area
Home Values in the Area
Average Home Value in this Area
Purchase History
| Date | Buyer | Sale Price | Title Company |
|---|---|---|---|
| Drwiega Helena E | -- | None Available | |
| Drwiega Chester | -- | First American Title | |
| Drwiega Czeslaw | $235,000 | -- | |
| World S & L Assn | -- | -- |
Source: Public Records
Mortgage History
| Date | Status | Borrower | Loan Amount |
|---|---|---|---|
| Closed | Drwiega Chester | $191,000 | |
| Previous Owner | Drwiega Czeslaw | $188,000 |
Source: Public Records
Tax History Compared to Growth
Tax History
| Year | Tax Paid | Tax Assessment Tax Assessment Total Assessment is a certain percentage of the fair market value that is determined by local assessors to be the total taxable value of land and additions on the property. | Land | Improvement |
|---|---|---|---|---|
| 2024 | $8,857 | $45,000 | $21,840 | $23,160 |
| 2023 | $8,343 | $45,000 | $21,840 | $23,160 |
| 2022 | $8,343 | $45,000 | $21,840 | $23,160 |
| 2021 | $4,787 | $24,419 | $15,697 | $8,722 |
| 2020 | $4,813 | $24,419 | $15,697 | $8,722 |
| 2019 | $5,339 | $26,835 | $15,697 | $11,138 |
| 2018 | $8,553 | $39,387 | $12,967 | $26,420 |
| 2017 | $9,202 | $43,156 | $12,967 | $30,189 |
| 2016 | $8,838 | $43,156 | $12,967 | $30,189 |
| 2015 | $8,644 | $37,444 | $10,578 | $26,866 |
| 2014 | $8,520 | $37,444 | $10,578 | $26,866 |
| 2013 | $8,122 | $37,444 | $10,578 | $26,866 |
Source: Public Records
Map
Nearby Homes
- 10059 Frontage Rd Unit F
- 408 Lavergne Ave
- 412 Lavergne Ave
- 901 E Glenwood Rd
- 808 Indian Rd
- 623 Echo Ln
- 10039 Lacrosse Ave
- 9725 Woods Dr Unit 1913
- 9725 Woods Dr Unit 802
- 9725 Woods Dr Unit 309
- 9725 Woods Dr Unit 2015
- 9715 Woods Dr Unit 1110
- 9715 Woods Dr Unit 1104
- 9655 Woods Dr Unit 1304
- 9655 Woods Dr Unit P350
- 542 Laramie Ave
- 414 Skokie Ct
- 4710 Russett Ln Unit R1
- 10124 Peach Pkwy Unit N208
- 639 Harms Rd