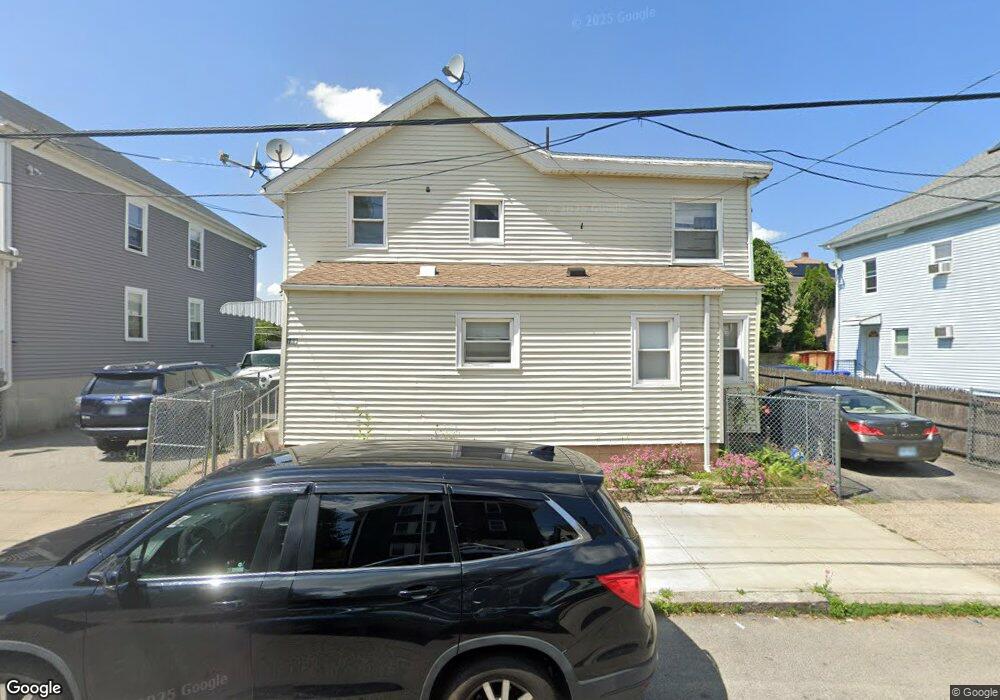
119 Magill St Pawtucket, RI 02860
Woodlawn NeighborhoodEstimated Value: $475,608 - $525,000
6
Beds
2
Baths
1,593
Sq Ft
$313/Sq Ft
Est. Value
About This Home
This home is located at 119 Magill St, Pawtucket, RI 02860 and is currently estimated at $498,152, approximately $312 per square foot. 119 Magill St is a home located in Providence County with nearby schools including International Charter School, Blackstone Valley Prep Junior High School, and Blackstone Academy Charter School.
Ownership History
Date
Name
Owned For
Owner Type
Purchase Details
Closed on
Dec 22, 1997
Sold by
Yardley Group Inc
Bought by
Villegas Emilio and Villegas William
Current Estimated Value
Home Financials for this Owner
Home Financials are based on the most recent Mortgage that was taken out on this home.
Original Mortgage
$68,850
Interest Rate
7.14%
Purchase Details
Closed on
Jan 16, 1992
Sold by
Joyce Gary A
Bought by
Blandon J Fernando
Create a Home Valuation Report for This Property
The Home Valuation Report is an in-depth analysis detailing your home's value as well as a comparison with similar homes in the area
Home Values in the Area
Average Home Value in this Area
Purchase History
| Date | Buyer | Sale Price | Title Company |
|---|---|---|---|
| Villegas Emilio | $69,000 | -- | |
| Blandon J Fernando | $97,000 | -- |
Source: Public Records
Mortgage History
| Date | Status | Borrower | Loan Amount |
|---|---|---|---|
| Open | Blandon J Fernando | $149,000 | |
| Closed | Blandon J Fernando | $118,900 | |
| Closed | Blandon J Fernando | $10,763 | |
| Closed | Blandon J Fernando | $68,850 |
Source: Public Records
Tax History Compared to Growth
Tax History
| Year | Tax Paid | Tax Assessment Tax Assessment Total Assessment is a certain percentage of the fair market value that is determined by local assessors to be the total taxable value of land and additions on the property. | Land | Improvement |
|---|---|---|---|---|
| 2025 | $4,605 | $350,200 | $116,800 | $233,400 |
| 2024 | $4,321 | $350,200 | $116,800 | $233,400 |
| 2023 | $3,683 | $217,400 | $52,600 | $164,800 |
| 2022 | $3,604 | $217,400 | $52,600 | $164,800 |
| 2021 | $3,604 | $217,400 | $52,600 | $164,800 |
| 2020 | $3,390 | $162,300 | $53,300 | $109,000 |
| 2019 | $3,390 | $162,300 | $53,300 | $109,000 |
| 2018 | $3,267 | $162,300 | $53,300 | $109,000 |
| 2017 | $2,842 | $125,100 | $40,100 | $85,000 |
| 2016 | $2,738 | $125,100 | $40,100 | $85,000 |
| 2015 | $2,738 | $125,100 | $40,100 | $85,000 |
| 2014 | $2,977 | $129,100 | $51,500 | $77,600 |
Source: Public Records
Map
Nearby Homes