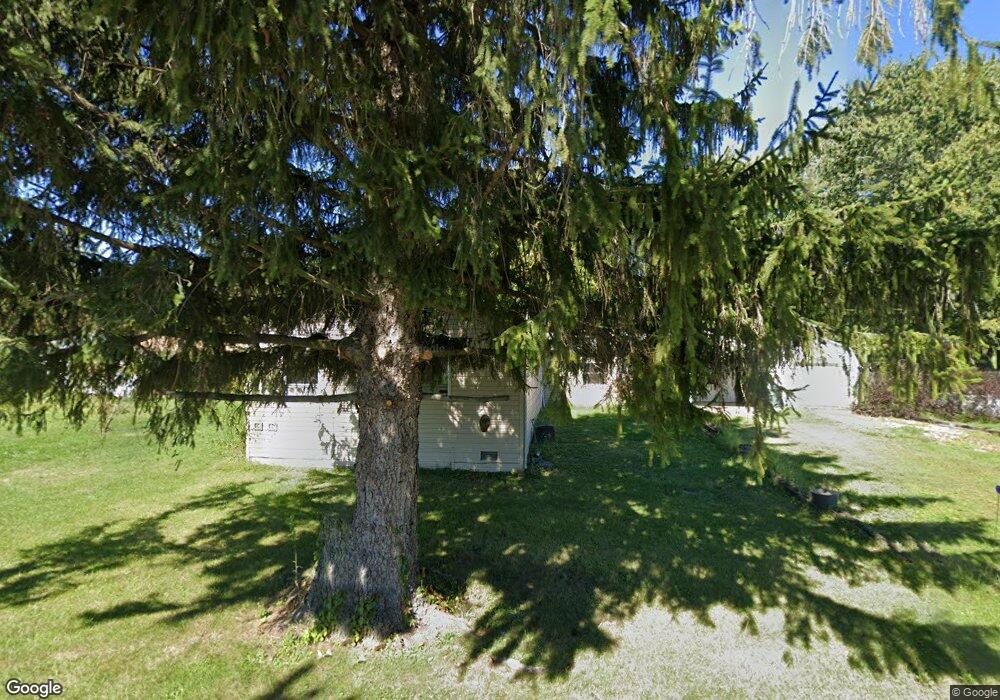
119 Main St Wellington, OH 44090
Estimated Value: $115,000 - $179,000
2
Beds
1
Bath
1,176
Sq Ft
$126/Sq Ft
Est. Value
About This Home
This home is located at 119 Main St, Wellington, OH 44090 and is currently estimated at $148,604, approximately $126 per square foot. 119 Main St is a home with nearby schools including New London Elementary School, New London Middle School, and New London High School.
Ownership History
Date
Name
Owned For
Owner Type
Purchase Details
Closed on
Jun 24, 2010
Sold by
Classic Holdings Llc
Bought by
Garska Clarence E and Garska Pat
Current Estimated Value
Home Financials for this Owner
Home Financials are based on the most recent Mortgage that was taken out on this home.
Original Mortgage
$44,753
Interest Rate
7%
Mortgage Type
Seller Take Back
Purchase Details
Closed on
Oct 16, 2006
Sold by
Wells Fargo Bank Na
Bought by
Classic Holdings Llc
Purchase Details
Closed on
Jun 19, 2006
Sold by
Greene Rodney W and Greene Rodney
Bought by
Wells Fargo Bank Na
Purchase Details
Closed on
May 29, 2002
Sold by
Welch Charles R and Welch Ellen B
Bought by
Greene Rodney W and Greene Rhonda D
Purchase Details
Closed on
Feb 2, 1995
Sold by
Green William R
Bought by
Green Rodney and Green Rhonda
Home Financials for this Owner
Home Financials are based on the most recent Mortgage that was taken out on this home.
Original Mortgage
$20,500
Interest Rate
9.24%
Mortgage Type
New Conventional
Create a Home Valuation Report for This Property
The Home Valuation Report is an in-depth analysis detailing your home's value as well as a comparison with similar homes in the area
Home Values in the Area
Average Home Value in this Area
Purchase History
| Date | Buyer | Sale Price | Title Company |
|---|---|---|---|
| Garska Clarence E | $47,800 | Attorney | |
| Classic Holdings Llc | $18,000 | Rels Title | |
| Wells Fargo Bank Na | $16,000 | None Available | |
| Greene Rodney W | $2,566 | -- | |
| Green Rodney | $5,900 | -- |
Source: Public Records
Mortgage History
| Date | Status | Borrower | Loan Amount |
|---|---|---|---|
| Closed | Garska Clarence E | $44,753 | |
| Previous Owner | Green Rodney | $20,500 |
Source: Public Records
Tax History Compared to Growth
Tax History
| Year | Tax Paid | Tax Assessment Tax Assessment Total Assessment is a certain percentage of the fair market value that is determined by local assessors to be the total taxable value of land and additions on the property. | Land | Improvement |
|---|---|---|---|---|
| 2024 | $977 | $32,862 | $3,812 | $29,050 |
| 2023 | $926 | $29,726 | $6,629 | $23,097 |
| 2022 | $932 | $29,726 | $6,629 | $23,097 |
| 2021 | $886 | $29,726 | $6,629 | $23,097 |
| 2020 | $811 | $25,960 | $5,790 | $20,170 |
| 2019 | $802 | $25,960 | $5,790 | $20,170 |
| 2018 | $919 | $24,350 | $5,790 | $18,560 |
| 2017 | $1,116 | $23,770 | $4,960 | $18,810 |
| 2016 | $1,117 | $23,770 | $4,960 | $18,810 |
| 2015 | $1,111 | $23,770 | $4,960 | $18,810 |
| 2014 | $1,133 | $23,770 | $4,960 | $18,810 |
| 2013 | $1,117 | $23,770 | $4,960 | $18,810 |
Source: Public Records
Map
Nearby Homes
- 202 S State St
- 816 Butler Rd S
- 22697 Gore Orphanage Rd
- 0 Butler Rd N
- 52814 New London Eastern Rd
- 25600 Mcmillan Rd
- 20303 Mosher Rd
- 44544 Stewart Rd
- 20765 Quarry Rd
- 25670 State Route 58
- 20011 Gore Orphanage Rd
- 0 County Road 40
- 26479 Ohio 58
- 208 Jones Rd
- 238 Reserve Cir
- 21251 Pitts Rd
- 428 Prospect St
- 19750 Mosher Rd
- 46748 New London Eastern Rd
- 124 Wheeling Ave