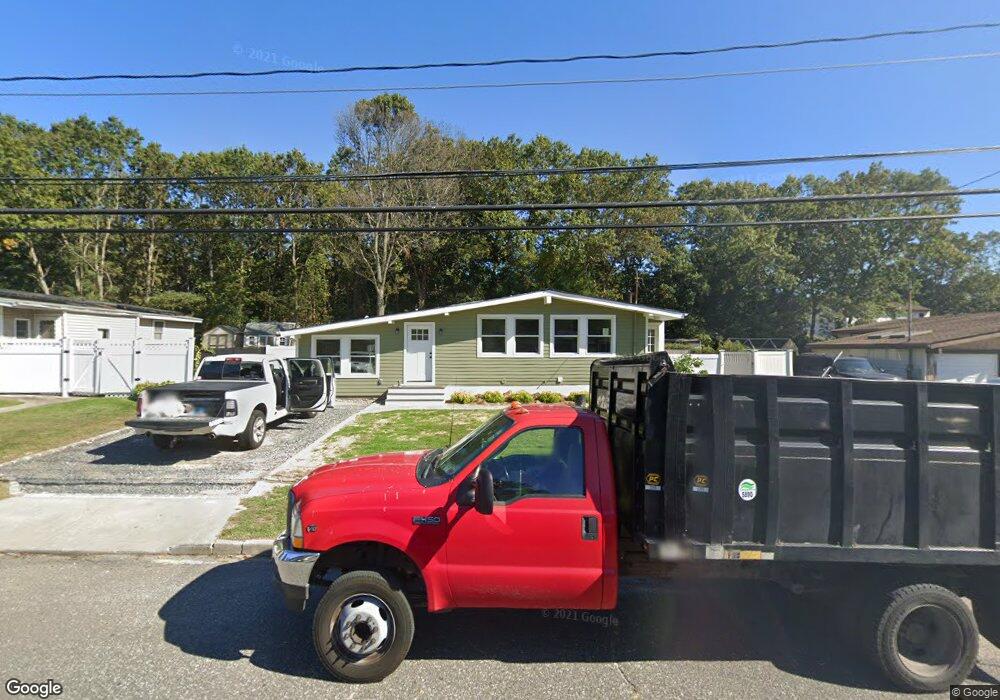
119 Maplecrest Dr Ronkonkoma, NY 11779
Estimated Value: $605,000 - $694,000
3
Beds
2
Baths
1,300
Sq Ft
$498/Sq Ft
Est. Value
About This Home
This home is located at 119 Maplecrest Dr, Ronkonkoma, NY 11779 and is currently estimated at $646,914, approximately $497 per square foot. 119 Maplecrest Dr is a home located in Suffolk County with nearby schools including Nokomis School, Seneca Middle School, and Sachem High School North.
Ownership History
Date
Name
Owned For
Owner Type
Purchase Details
Closed on
Jan 3, 2020
Sold by
Safeguard Homes Llc
Bought by
Lopez Diana A and Morel Oscar
Current Estimated Value
Home Financials for this Owner
Home Financials are based on the most recent Mortgage that was taken out on this home.
Original Mortgage
$407,237
Interest Rate
3.6%
Mortgage Type
FHA
Purchase Details
Closed on
Jan 17, 2019
Sold by
Fhlm
Bought by
Safeguard Homes Llc
Purchase Details
Closed on
Jun 1, 2000
Sold by
Devine William J and Devine Thomas
Bought by
Devine William J
Purchase Details
Closed on
Oct 9, 1998
Sold by
Centrella William and Centrella Barbara
Bought by
Devine William J and Devine Thomas L
Home Financials for this Owner
Home Financials are based on the most recent Mortgage that was taken out on this home.
Original Mortgage
$111,452
Interest Rate
6.68%
Mortgage Type
FHA
Create a Home Valuation Report for This Property
The Home Valuation Report is an in-depth analysis detailing your home's value as well as a comparison with similar homes in the area
Home Values in the Area
Average Home Value in this Area
Purchase History
| Date | Buyer | Sale Price | Title Company |
|---|---|---|---|
| Lopez Diana A | $420,000 | None Available | |
| Safeguard Homes Llc | $240,000 | -- | |
| Devine William J | -- | Stewart Title | |
| Devine William J | $119,000 | Fidelity National Title Ins |
Source: Public Records
Mortgage History
| Date | Status | Borrower | Loan Amount |
|---|---|---|---|
| Previous Owner | Lopez Diana A | $407,237 | |
| Previous Owner | Devine William J | $111,452 |
Source: Public Records
Tax History Compared to Growth
Tax History
| Year | Tax Paid | Tax Assessment Tax Assessment Total Assessment is a certain percentage of the fair market value that is determined by local assessors to be the total taxable value of land and additions on the property. | Land | Improvement |
|---|---|---|---|---|
| 2024 | $10,246 | $2,700 | $150 | $2,550 |
| 2023 | $10,246 | $2,700 | $150 | $2,550 |
| 2022 | $8,073 | $2,700 | $150 | $2,550 |
| 2021 | $8,073 | $2,700 | $150 | $2,550 |
| 2020 | $9,102 | $2,700 | $150 | $2,550 |
| 2019 | $9,102 | $0 | $0 | $0 |
| 2018 | $7,801 | $2,350 | $150 | $2,200 |
| 2017 | $7,801 | $2,350 | $150 | $2,200 |
| 2016 | $7,749 | $2,350 | $150 | $2,200 |
| 2015 | -- | $2,350 | $150 | $2,200 |
| 2014 | -- | $2,350 | $150 | $2,200 |
Source: Public Records
Map
Nearby Homes
- 117 Maplecrest Dr
- 121 Maplecrest Dr
- 123 Maplecrest Dr
- 115 Maplecrest Dr
- 19 Borman Ct
- 118 Maplecrest Dr
- 116 Maplecrest Dr
- 120 Maplecrest Dr
- 20 Borman Ct
- 125 Maplecrest Dr
- 114 Maplecrest Dr
- 113 Maplecrest Dr
- 122 Maplecrest Dr
- 112 Maplecrest Dr
- 127 Maplecrest Dr
- 124 Maplecrest Dr
- 111 Maplecrest Dr
- 17 Borman Ct
- 37 University Dr
- 39 University Dr