Estimated Value: $286,000 - $359,000
--
Bed
1
Bath
1,922
Sq Ft
$174/Sq Ft
Est. Value
About This Home
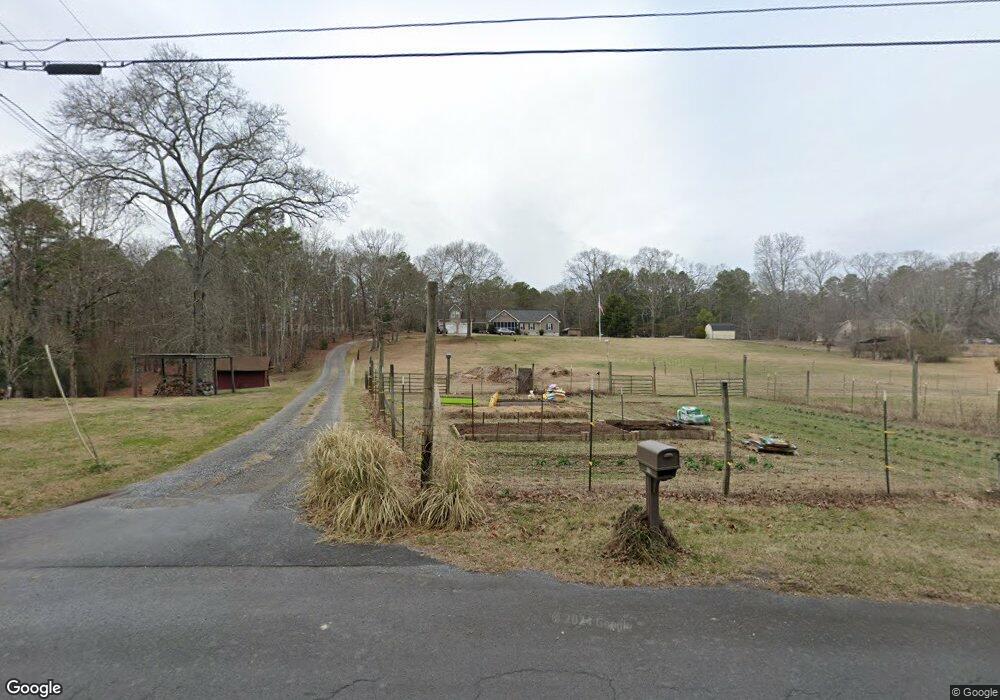
This home is located at 119 Mathis Rd NE, Rome, GA 30161 and is currently estimated at $333,652, approximately $173 per square foot. 119 Mathis Rd NE is a home located in Floyd County with nearby schools including Model Middle School, Model High School, and Unity Christian School.
Ownership History
Date
Name
Owned For
Owner Type
Purchase Details
Closed on
Jul 31, 1985
Sold by
Nolan James D
Bought by
Nolan James D and Nolan Terry B
Current Estimated Value
Purchase Details
Closed on
Jan 29, 1985
Bought by
P and R
Purchase Details
Closed on
Apr 4, 1980
Sold by
Jones Howard W Trus Est Thomas A Poindex
Bought by
Nolan James D
Purchase Details
Closed on
Sep 4, 1979
Sold by
Poindexter Jacqueline L
Bought by
Jones Howard W Trus Est Thomas A Poindex
Purchase Details
Closed on
Sep 18, 1978
Bought by
P and R
Purchase Details
Closed on
May 20, 1975
Sold by
Poindexter Thomas A
Bought by
Poindexter Jacqueline L
Purchase Details
Closed on
Oct 10, 1968
Sold by
Alexander Alexander E and Alexander Charles
Bought by
Poindexter Thomas A
Purchase Details
Closed on
May 9, 1967
Sold by
Cooper C A
Bought by
Alexander Alexander E and Alexander Charles
Purchase Details
Closed on
Jan 1, 1961
Bought by
Cooper C A
Create a Home Valuation Report for This Property
The Home Valuation Report is an in-depth analysis detailing your home's value as well as a comparison with similar homes in the area
Home Values in the Area
Average Home Value in this Area
Purchase History
| Date | Buyer | Sale Price | Title Company |
|---|---|---|---|
| Nolan James D | -- | -- | |
| P | -- | -- | |
| P | -- | -- | |
| Nolan James D | $4,700 | -- | |
| Jones Howard W Trus Est Thomas A Poindex | -- | -- | |
| P | -- | -- | |
| Poindexter Jacqueline L | -- | -- | |
| Poindexter Thomas A | $1,300 | -- | |
| Alexander Alexander E | $1,700 | -- | |
| Cooper C A | -- | -- |
Source: Public Records
Tax History Compared to Growth
Tax History
| Year | Tax Paid | Tax Assessment Tax Assessment Total Assessment is a certain percentage of the fair market value that is determined by local assessors to be the total taxable value of land and additions on the property. | Land | Improvement |
|---|---|---|---|---|
| 2024 | $2,236 | $128,634 | $16,738 | $111,896 |
| 2023 | $1,920 | $110,240 | $15,216 | $95,024 |
| 2022 | $1,683 | $93,447 | $12,553 | $80,894 |
| 2021 | $1,337 | $74,116 | $11,425 | $62,691 |
| 2020 | $769 | $64,820 | $9,935 | $54,885 |
| 2019 | $1,418 | $62,956 | $9,935 | $53,021 |
| 2018 | $1,381 | $60,651 | $9,463 | $51,188 |
| 2017 | $1,325 | $57,376 | $8,762 | $48,614 |
| 2016 | $1,332 | $56,908 | $8,760 | $48,148 |
| 2015 | $871 | $57,508 | $8,760 | $48,748 |
| 2014 | $871 | $33,474 | $8,760 | $24,714 |
Source: Public Records
Map
Nearby Homes
- 21 Everwood Ct SE
- 406 Fred Kelly Rd NE
- 45 Wildflower Rd NE
- 0 N Quarters Dr Unit 7467468
- 0 N Quarters Dr Unit 37 10390869
- 0 Fallen Branch Cir SE Unit 7397536
- 0 Fallen Branch Cir SE Unit 10311756
- 0 Fallen Branch Cir SE Unit 7234792
- 0 Fallen Branch Cir SE Unit 10172755
- 16 Fallen Branch Cir SE
- 3 Outpost Trail SE
- 1 Outpost Trail SE
- 567 Fred Kelley Rd NE
- 30 Mountain Creek Dr SE
- 492 Moran Lake Rd NE
- 0 Mountain Creek Dr SE Unit 10436191
- 158 Sproull Rd SE
- 0 Moran Lake Rd NE Unit 10592848
- 0 Moran Lake Rd NE Unit 7639960
- 0 Moran Lake Rd NE Unit 229 10584708
- 119 Mathis Rd NE
- 119 Mathis Rd NE
- 143 Mathis Rd NE
- 105 Mathis Rd NE
- 8 Garrett Rd NE
- 6 Garrett Rd NE
- 2 Garrett Rd NE
- 2 Garrett Rd NE
- 2 Garrett Rd NE
- 10 Garrett Rd NE
- 4 Garrett Rd NE
- 0 Garrett Rd NE Unit 7330818
- 0 Garrett Rd NE Unit 8308586
- 0 Garrett Rd NE Unit 8245261
- 0 Garrett Rd NE
- 167 Mathis Rd NE
- 9 Garrett Rd NE
- 11 Garrett Rd NE
- 94 Mathis Rd NE
- 3 Garrett Rd NE