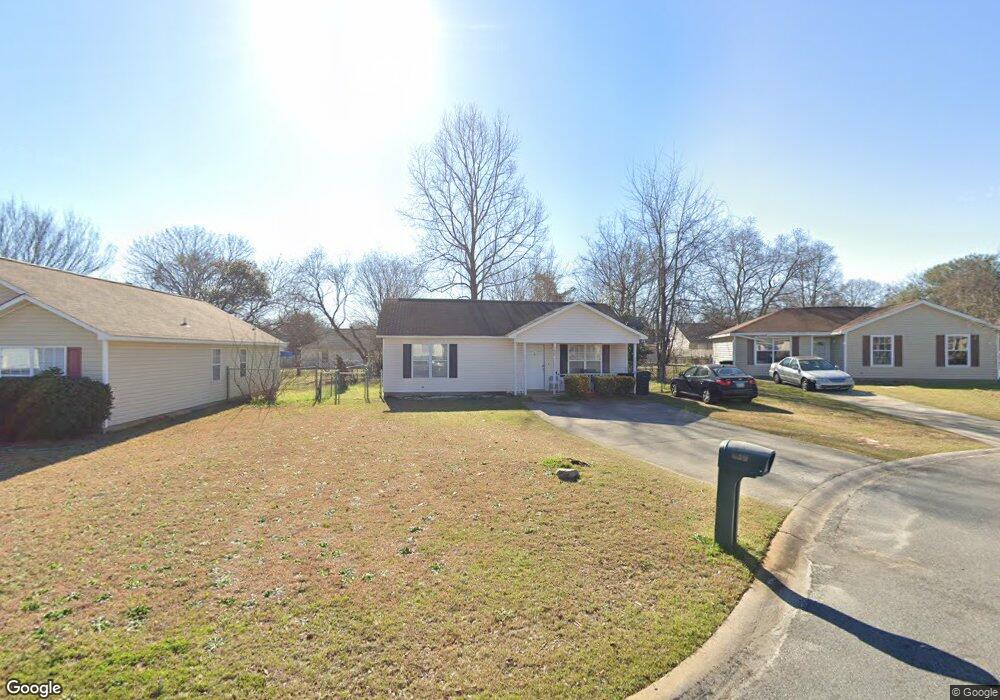
119 Mauldon Ct Warner Robins, GA 31093
Estimated Value: $124,000 - $155,000
2
Beds
2
Baths
1,057
Sq Ft
$131/Sq Ft
Est. Value
About This Home
This home is located at 119 Mauldon Ct, Warner Robins, GA 31093 and is currently estimated at $138,441, approximately $130 per square foot. 119 Mauldon Ct is a home located in Houston County with nearby schools including Parkwood Elementary School, Northside Middle School, and Northside High School.
Ownership History
Date
Name
Owned For
Owner Type
Purchase Details
Closed on
Jun 19, 2008
Sold by
Bank Of New York
Bought by
Tucker Curtis
Current Estimated Value
Home Financials for this Owner
Home Financials are based on the most recent Mortgage that was taken out on this home.
Original Mortgage
$55,134
Interest Rate
5.96%
Mortgage Type
FHA
Purchase Details
Closed on
Jan 13, 2006
Sold by
Duncan Bertha
Bought by
Duncan Bertha L
Home Financials for this Owner
Home Financials are based on the most recent Mortgage that was taken out on this home.
Original Mortgage
$65,700
Interest Rate
9.99%
Mortgage Type
Stand Alone Refi Refinance Of Original Loan
Purchase Details
Closed on
Oct 10, 1997
Sold by
Hudson William L
Bought by
Duncan Milford W and Duncan Bertha L
Purchase Details
Closed on
Jun 18, 1997
Sold by
Great American Builders Inc
Bought by
Hudson William L
Create a Home Valuation Report for This Property
The Home Valuation Report is an in-depth analysis detailing your home's value as well as a comparison with similar homes in the area
Home Values in the Area
Average Home Value in this Area
Purchase History
| Date | Buyer | Sale Price | Title Company |
|---|---|---|---|
| Tucker Curtis | $56,000 | None Available | |
| Duncan Bertha L | -- | None Available | |
| Duncan Milford W | $51,000 | -- | |
| Hudson William L | -- | -- |
Source: Public Records
Mortgage History
| Date | Status | Borrower | Loan Amount |
|---|---|---|---|
| Closed | Tucker Curtis | $55,134 | |
| Previous Owner | Duncan Bertha L | $65,700 |
Source: Public Records
Tax History
| Year | Tax Paid | Tax Assessment Tax Assessment Total Assessment is a certain percentage of the fair market value that is determined by local assessors to be the total taxable value of land and additions on the property. | Land | Improvement |
|---|---|---|---|---|
| 2025 | $1,366 | $46,920 | $6,000 | $40,920 |
| 2024 | $1,377 | $42,080 | $6,000 | $36,080 |
| 2023 | $1,045 | $31,680 | $6,000 | $25,680 |
| 2022 | $525 | $22,840 | $4,200 | $18,640 |
| 2021 | $478 | $20,680 | $4,200 | $16,480 |
| 2020 | $479 | $20,600 | $4,200 | $16,400 |
| 2019 | $479 | $20,600 | $4,200 | $16,400 |
| 2018 | $479 | $20,600 | $4,200 | $16,400 |
| 2017 | $479 | $20,600 | $4,200 | $16,400 |
| 2016 | $480 | $20,600 | $4,200 | $16,400 |
| 2015 | -- | $20,600 | $4,200 | $16,400 |
| 2014 | -- | $20,600 | $4,200 | $16,400 |
| 2013 | -- | $20,600 | $4,200 | $16,400 |
Source: Public Records
Map
Nearby Homes
- 212 Dunmurry Place
- 437 Dunmurry Place
- 302 Hawaii Ave
- 100 Mauldon Ct
- 405 Dunmurry Place
- 302 Dunmurry Place
- 111 Wisconsin Ave
- 239 Ward St
- 249 Ward St
- 102 Oregon Ct
- 145 Northsky Dr
- 422 Carolina Ave
- 427 Alabama Ave
- 300 Ward St
- 213 Oklahoma Ave
- 220 Francis St
- 108 Smith Place
- 714 Camellia Cir
- 500 Northside Dr
- 111 Briarwood Dr
- 117 Mauldon Ct
- 121 Mauldon Ct
- 211 Dunmurry Place
- 115 Mauldon Ct
- 209 Dunmurry Place
- 213 Dunmurry Place
- 207 Dunmurry Place
- 123 Mauldon Ct
- 215 Dunmurry Place
- 113 Mauldon Ct
- 120 Mauldon Ct
- 126 Mauldon Ct
- 205 Dunmurry Place
- 217 Dunmurry Place
- 118 Mauldon Ct
- 122 Mauldon Ct
- 124 Mauldon Ct
- 111 Mauldon Ct
- 116 Mauldon Ct
- 203 Dunmurry Place
Your Personal Tour Guide
Ask me questions while you tour the home.