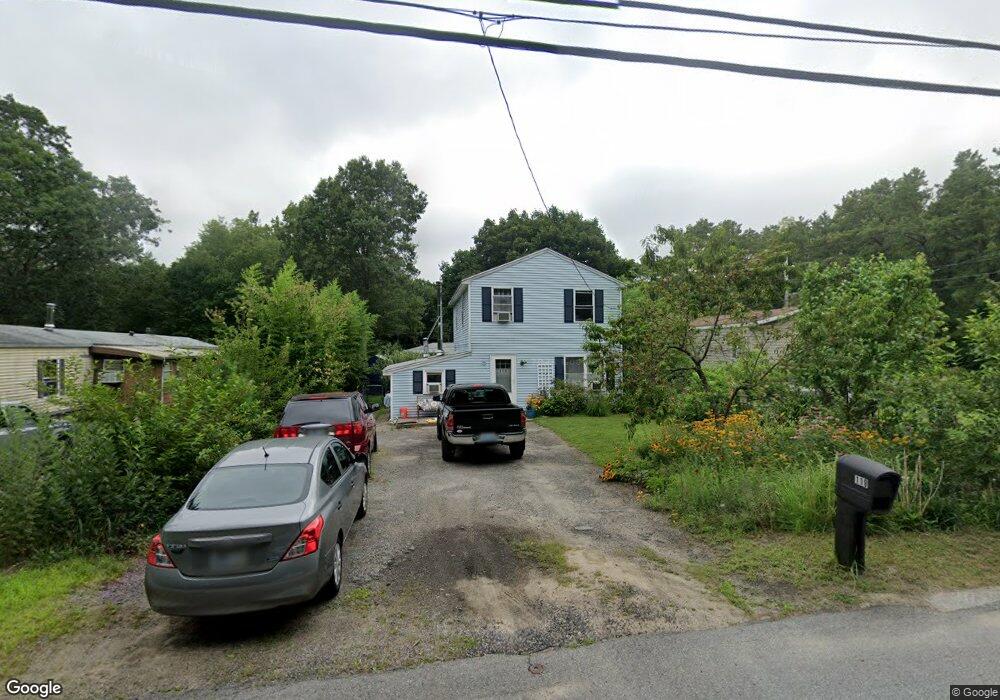
119 Mishnock Rd West Greenwich, RI 02817
Estimated Value: $292,000 - $364,782
4
Beds
2
Baths
1,370
Sq Ft
$246/Sq Ft
Est. Value
About This Home
This home is located at 119 Mishnock Rd, West Greenwich, RI 02817 and is currently estimated at $337,446, approximately $246 per square foot. 119 Mishnock Rd is a home located in Kent County with nearby schools including Mildred E. Lineham School, Metcalf School, and Wawaloam School.
Ownership History
Date
Name
Owned For
Owner Type
Purchase Details
Closed on
Aug 31, 2009
Sold by
Rbs Citizens Na
Bought by
Dubois Linda K and Dubois Charles D
Current Estimated Value
Home Financials for this Owner
Home Financials are based on the most recent Mortgage that was taken out on this home.
Original Mortgage
$86,250
Outstanding Balance
$55,890
Interest Rate
5.17%
Mortgage Type
Purchase Money Mortgage
Estimated Equity
$281,556
Purchase Details
Closed on
Jun 1, 2009
Sold by
Almeida Teresa M
Bought by
Rbs Citizens Bank Na
Create a Home Valuation Report for This Property
The Home Valuation Report is an in-depth analysis detailing your home's value as well as a comparison with similar homes in the area
Home Values in the Area
Average Home Value in this Area
Purchase History
| Date | Buyer | Sale Price | Title Company |
|---|---|---|---|
| Dubois Linda K | $115,000 | -- | |
| Rbs Citizens Bank Na | $119,736 | -- |
Source: Public Records
Mortgage History
| Date | Status | Borrower | Loan Amount |
|---|---|---|---|
| Open | Rbs Citizens Bank Na | $86,250 | |
| Previous Owner | Rbs Citizens Bank Na | $182,700 |
Source: Public Records
Tax History Compared to Growth
Tax History
| Year | Tax Paid | Tax Assessment Tax Assessment Total Assessment is a certain percentage of the fair market value that is determined by local assessors to be the total taxable value of land and additions on the property. | Land | Improvement |
|---|---|---|---|---|
| 2025 | $3,586 | $224,100 | $87,800 | $136,300 |
| 2024 | $3,586 | $224,100 | $87,800 | $136,300 |
| 2023 | $3,848 | $157,000 | $61,900 | $95,100 |
| 2022 | $3,848 | $157,000 | $61,900 | $95,100 |
| 2021 | $3,773 | $157,000 | $61,900 | $95,100 |
| 2020 | $3,735 | $157,000 | $61,900 | $95,100 |
| 2019 | $3,995 | $165,300 | $76,800 | $88,500 |
| 2018 | $3,369 | $142,200 | $53,700 | $88,500 |
| 2017 | $3,207 | $142,200 | $53,700 | $88,500 |
| 2016 | $3,022 | $134,000 | $53,900 | $80,100 |
| 2015 | $3,022 | $134,000 | $53,900 | $80,100 |
| 2013 | $2,855 | $126,600 | $58,200 | $68,400 |
Source: Public Records
Map
Nearby Homes