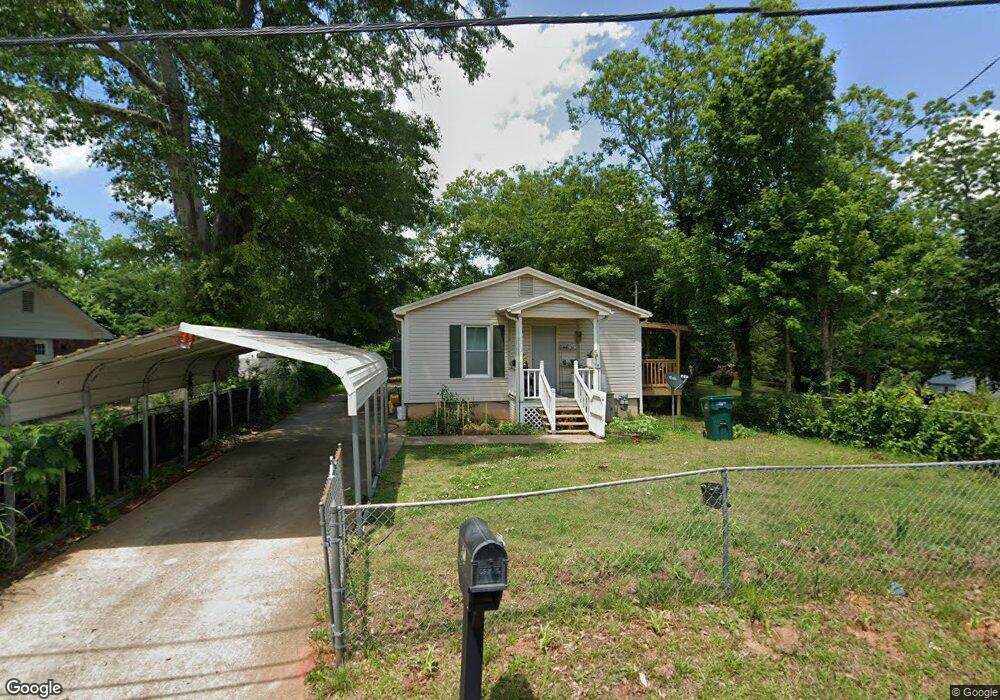
119 Mount Zion Blvd Carrollton, GA 30117
Estimated Value: $127,000 - $203,000
3
Beds
2
Baths
960
Sq Ft
$180/Sq Ft
Est. Value
About This Home
This home is located at 119 Mount Zion Blvd, Carrollton, GA 30117 and is currently estimated at $172,437, approximately $179 per square foot. 119 Mount Zion Blvd is a home located in Carroll County with nearby schools including Carrollton Elementary School, Carrollton Upper Elementary School, and Carrollton Middle School.
Ownership History
Date
Name
Owned For
Owner Type
Purchase Details
Closed on
Oct 14, 2022
Sold by
Fuentes Lastenia Lemus
Bought by
Fuentes Lastenia Lemus and Lemun Keslin Brizvela
Current Estimated Value
Home Financials for this Owner
Home Financials are based on the most recent Mortgage that was taken out on this home.
Original Mortgage
$163,400
Interest Rate
5.3%
Mortgage Type
New Conventional
Purchase Details
Closed on
Aug 23, 2022
Sold by
Covarrubias Elias
Bought by
Fuentes Lastenia Lemus
Home Financials for this Owner
Home Financials are based on the most recent Mortgage that was taken out on this home.
Original Mortgage
$163,400
Interest Rate
5.3%
Mortgage Type
New Conventional
Purchase Details
Closed on
Jun 5, 2018
Sold by
Sanchez Jose D
Bought by
Covarrubias Elias
Purchase Details
Closed on
Dec 6, 2017
Sold by
Crowder Oscar Cornelius
Bought by
Sanchez Jose D and Covarrubias Elias
Purchase Details
Closed on
Nov 1, 1981
Sold by
Crowder Wyatt
Bought by
Crowder Iscar Cornelius
Create a Home Valuation Report for This Property
The Home Valuation Report is an in-depth analysis detailing your home's value as well as a comparison with similar homes in the area
Home Values in the Area
Average Home Value in this Area
Purchase History
| Date | Buyer | Sale Price | Title Company |
|---|---|---|---|
| Fuentes Lastenia Lemus | -- | -- | |
| Fuentes Lastenia Lemus | $172,000 | -- | |
| Covarrubias Elias | -- | -- | |
| Sanchez Jose D | $49,900 | -- | |
| Crowder Iscar Cornelius | -- | -- |
Source: Public Records
Mortgage History
| Date | Status | Borrower | Loan Amount |
|---|---|---|---|
| Previous Owner | Fuentes Lastenia Lemus | $163,400 |
Source: Public Records
Tax History Compared to Growth
Tax History
| Year | Tax Paid | Tax Assessment Tax Assessment Total Assessment is a certain percentage of the fair market value that is determined by local assessors to be the total taxable value of land and additions on the property. | Land | Improvement |
|---|---|---|---|---|
| 2024 | $1,238 | $45,290 | $4,589 | $40,701 |
| 2023 | $1,238 | $41,702 | $4,590 | $37,112 |
| 2022 | $958 | $32,803 | $3,067 | $29,736 |
| 2021 | $814 | $27,896 | $2,272 | $25,624 |
| 2020 | $735 | $25,141 | $2,272 | $22,869 |
| 2019 | $685 | $23,210 | $2,272 | $20,938 |
| 2018 | $597 | $20,249 | $2,272 | $17,977 |
| 2017 | $609 | $20,249 | $2,272 | $17,977 |
| 2016 | $136 | $20,249 | $2,272 | $17,977 |
| 2015 | $138 | $20,446 | $4,000 | $16,446 |
| 2014 | $139 | $20,446 | $4,000 | $16,446 |
Source: Public Records
Map
Nearby Homes
- 405 N Park St
- TRACT1-7 Us Highway 27
- 654 King St
- 108 Springwood Dr
- 0 Ward St Unit 10390499
- 205 Johnson Ave Unit 231
- 110 Town Walk Ln
- 109 S Park St
- 103 W Chandler St
- 160 Watson St
- 301 C4 Bradley St
- 109 7th St
- 250 Riversong Rd
- 250 Riversong Rd Unit 55
- 301 Bradley St
- 149 River Dr
- 149 River Dr Unit 42
- 777 College St
- 219 Broad St
- 27 South St
- 119 Mount Zion Blvd
- 119 Mount Zion Blvd
- 123 Mount Zion Blvd
- 106 Willie North St
- 112 Mount Zion Blvd
- 124 Mount Zion Blvd
- 127 Mt Zion Blvd
- 127 Mount Zion Blvd
- 109 Willie North St
- 105 Willie St N
- 128 Mount Zion Blvd
- 105 Willie North St
- 105 Willie North St
- 134 Mount Zion Blvd
- 506 Martin Luther King jr St
- 310 Martin Luther King jr St
- 510 Martin Luther King jr St
- 138 Mount Zion Blvd
- 516 Spring St
- 518 Spring St