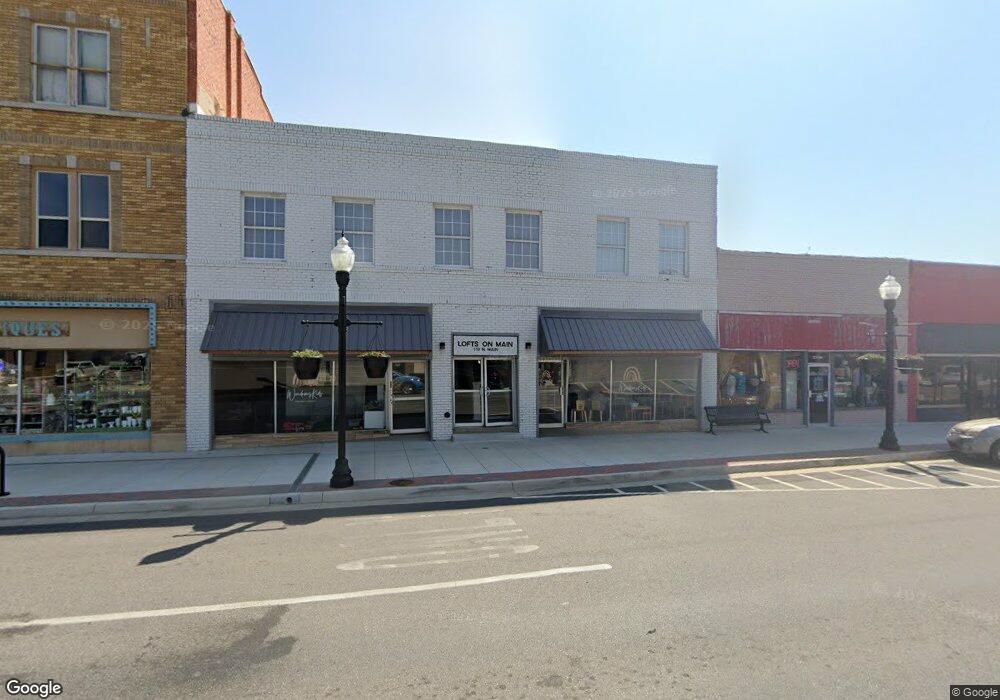
119 N Main St Sand Springs, OK 74063
Estimated Value: $693,875
--
Bed
--
Bath
8,706
Sq Ft
$80/Sq Ft
Est. Value
About This Home
This home is located at 119 N Main St, Sand Springs, OK 74063 and is currently priced at $693,875, approximately $79 per square foot. 119 N Main St is a home located in Tulsa County with nearby schools including Garfield STEAM Academy, Northwoods Fine Arts Academy, and Clyde Boyd Middle School.
Ownership History
Date
Name
Owned For
Owner Type
Purchase Details
Closed on
Mar 16, 2015
Sold by
Sand Springs Building Llc
Bought by
46Th Street Properties Llc
Current Estimated Value
Home Financials for this Owner
Home Financials are based on the most recent Mortgage that was taken out on this home.
Original Mortgage
$292,185
Outstanding Balance
$223,784
Interest Rate
3.68%
Mortgage Type
Future Advance Clause Open End Mortgage
Create a Home Valuation Report for This Property
The Home Valuation Report is an in-depth analysis detailing your home's value as well as a comparison with similar homes in the area
Home Values in the Area
Average Home Value in this Area
Purchase History
| Date | Buyer | Sale Price | Title Company |
|---|---|---|---|
| 46Th Street Properties Llc | $387,000 | Commercial Title & Escrow Sv |
Source: Public Records
Mortgage History
| Date | Status | Borrower | Loan Amount |
|---|---|---|---|
| Open | 46Th Street Properties Llc | $292,185 |
Source: Public Records
Tax History Compared to Growth
Tax History
| Year | Tax Paid | Tax Assessment Tax Assessment Total Assessment is a certain percentage of the fair market value that is determined by local assessors to be the total taxable value of land and additions on the property. | Land | Improvement |
|---|---|---|---|---|
| 2024 | $6,588 | $52,195 | $2,475 | $49,720 |
| 2023 | $6,588 | $52,195 | $2,475 | $49,720 |
| 2022 | $6,439 | $52,195 | $2,475 | $49,720 |
| 2021 | $6,491 | $51,744 | $2,454 | $49,290 |
| 2020 | $6,401 | $49,280 | $2,337 | $46,943 |
| 2019 | $5,925 | $46,934 | $2,226 | $44,708 |
| 2018 | $5,496 | $44,699 | $2,024 | $42,675 |
| 2017 | $5,130 | $42,570 | $2,475 | $40,095 |
| 2016 | $5,236 | $42,570 | $2,475 | $40,095 |
| 2015 | $6,176 | $49,500 | $2,475 | $47,025 |
| 2014 | $6,231 | $49,500 | $2,475 | $47,025 |
Source: Public Records
Map
Nearby Homes
- 3 S 265th West Ave
- 4 S 265th West Ave
- 411 N Roosevelt Ave
- 214 N Wilson
- 513 N Main St
- 306 N Grant Ave
- 523 N Roosevelt Ave
- 608 N Mckinley Ave
- 610 N Garfield Ave
- 608 N Roosevelt Ave
- 307 N Industrial Ave
- 405 N Industrial Ave
- 416 N Franklin Ave
- 518 N Franklin Ave
- 600 N Franklin Ave
- 0 N Franklin Ave
- 907 N Wilson Ave
- 820 N Grant Ave
- 706 Forest Dr
- 824 Long St
- 113 N Main St
- 111 N Main St
- 117 N Main St
- 117 N Main St
- 107 N Main St
- 0 E 2nd St Unit 1836140
- 0 E 2nd St Unit 1911760
- 0 E 2nd St Unit 1936484
- 0 E 2nd St
- 103 N Main St
- 118 N Main St
- 105 N Main St
- 111 W 1st St
- 14 W 2nd St
- 100 E 2nd St
- 102 E 2nd St
- 216 N Main St
- 2 E Broadway St Unit C
- 0 E Broadway St
- 116 N Garfield Ave