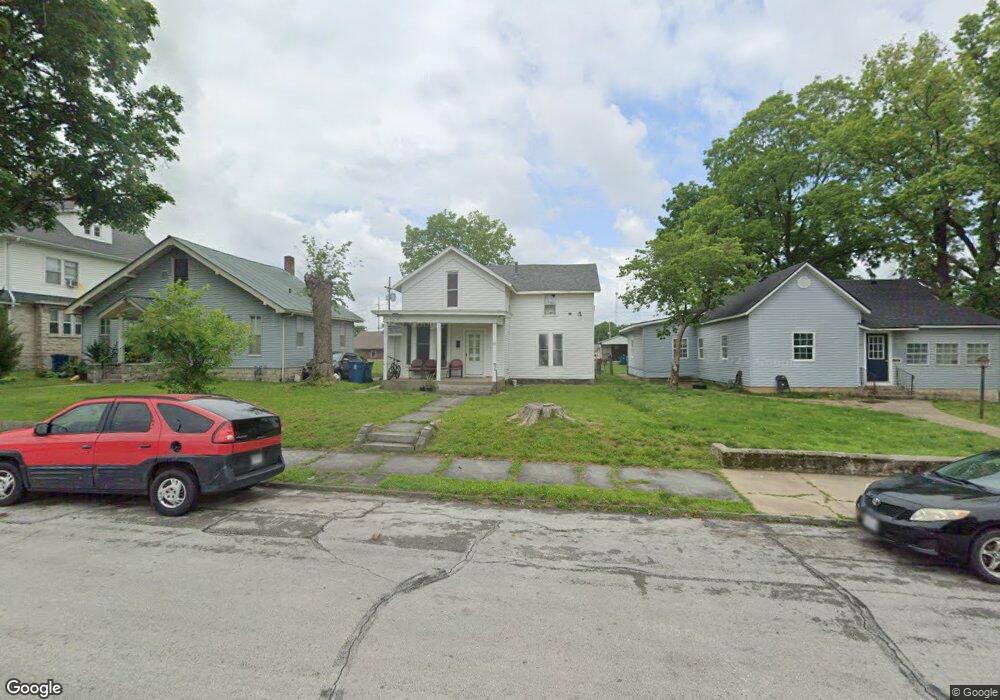
119 N Maple St Carthage, MO 64836
Estimated Value: $144,000 - $178,000
4
Beds
2
Baths
1,744
Sq Ft
$93/Sq Ft
Est. Value
About This Home
This home is located at 119 N Maple St, Carthage, MO 64836 and is currently estimated at $162,491, approximately $93 per square foot. 119 N Maple St is a home located in Jasper County with nearby schools including Carthage High School, Victory Academy, and St. Ann's Catholic School.
Ownership History
Date
Name
Owned For
Owner Type
Purchase Details
Closed on
Sep 22, 2017
Sold by
Sanchez Augustin and Sanchez Sarah
Bought by
Figueroa Pedro
Current Estimated Value
Home Financials for this Owner
Home Financials are based on the most recent Mortgage that was taken out on this home.
Original Mortgage
$56,988
Outstanding Balance
$47,423
Interest Rate
3.86%
Mortgage Type
New Conventional
Estimated Equity
$115,068
Purchase Details
Closed on
Jun 2, 2009
Sold by
Ross Daniel W and Ross Sarah L
Bought by
Sanchez Agustin and Sanchez Sarah
Home Financials for this Owner
Home Financials are based on the most recent Mortgage that was taken out on this home.
Original Mortgage
$56,878
Interest Rate
4.76%
Mortgage Type
FHA
Purchase Details
Closed on
Nov 20, 2008
Sold by
Maple Leaf Investment Company
Bought by
Ross Daniel W
Purchase Details
Closed on
Oct 28, 2005
Sold by
Mccoy Michael J
Bought by
Maple Leaf Investment Co
Create a Home Valuation Report for This Property
The Home Valuation Report is an in-depth analysis detailing your home's value as well as a comparison with similar homes in the area
Home Values in the Area
Average Home Value in this Area
Purchase History
| Date | Buyer | Sale Price | Title Company |
|---|---|---|---|
| Figueroa Pedro | -- | None Available | |
| Sanchez Agustin | -- | Fatco | |
| Ross Daniel W | -- | None Available | |
| Maple Leaf Investment Co | -- | Fatco |
Source: Public Records
Mortgage History
| Date | Status | Borrower | Loan Amount |
|---|---|---|---|
| Open | Figueroa Pedro | $56,988 | |
| Previous Owner | Sanchez Agustin | $56,878 |
Source: Public Records
Tax History
| Year | Tax Paid | Tax Assessment Tax Assessment Total Assessment is a certain percentage of the fair market value that is determined by local assessors to be the total taxable value of land and additions on the property. | Land | Improvement |
|---|---|---|---|---|
| 2025 | $545 | $12,050 | $570 | $11,480 |
| 2024 | $545 | $10,580 | $570 | $10,010 |
| 2023 | $545 | $10,580 | $570 | $10,010 |
| 2022 | $530 | $10,340 | $570 | $9,770 |
| 2021 | $525 | $10,340 | $570 | $9,770 |
| 2020 | $501 | $9,470 | $570 | $8,900 |
| 2019 | $502 | $9,470 | $570 | $8,900 |
| 2018 | $501 | $9,470 | $0 | $0 |
| 2017 | $502 | $9,470 | $0 | $0 |
| 2016 | $501 | $9,470 | $0 | $0 |
| 2015 | $501 | $9,470 | $0 | $0 |
| 2014 | $501 | $9,470 | $0 | $0 |
Source: Public Records
Map
Nearby Homes
- 300 N Maple St
- 703 W Central Tract 2
- 424 Walnut St
- 431 S Orner St
- 802 Oak St
- 903 S Main St
- 514 Poplar St
- 1007 Grant St
- 1014 S Main St
- 1018 Olive St
- 112 E 11th St
- 1101 Oak St
- 1131 Lyon St
- 1135 S Maple St
- 1144 S Main St
- 1160 S Maple St
- 1112 S Garrison Ave
- 1324 W Central Ave
- 518 E Macon St
- 1143 S Case St
- 123 N Maple St
- 115 N Maple St
- 109 N Maple St
- 129 N Maple St
- 131 N Maple St
- 312 W Mound St
- 301 W Central Ave
- 122 N Maple St
- 130 N Garrison Ave
- 201 N Maple St
- 201 N Maple St Unit 1
- 309 W Mound St
- 102 N Garrison Ave
- 130 N Maple St
- 205 N Maple St
- 319 W Mound St
- 200 N Maple St
- 323 W Mound St
- 200 N Garrison Ave
- 209 N Maple St
Your Personal Tour Guide
Ask me questions while you tour the home.