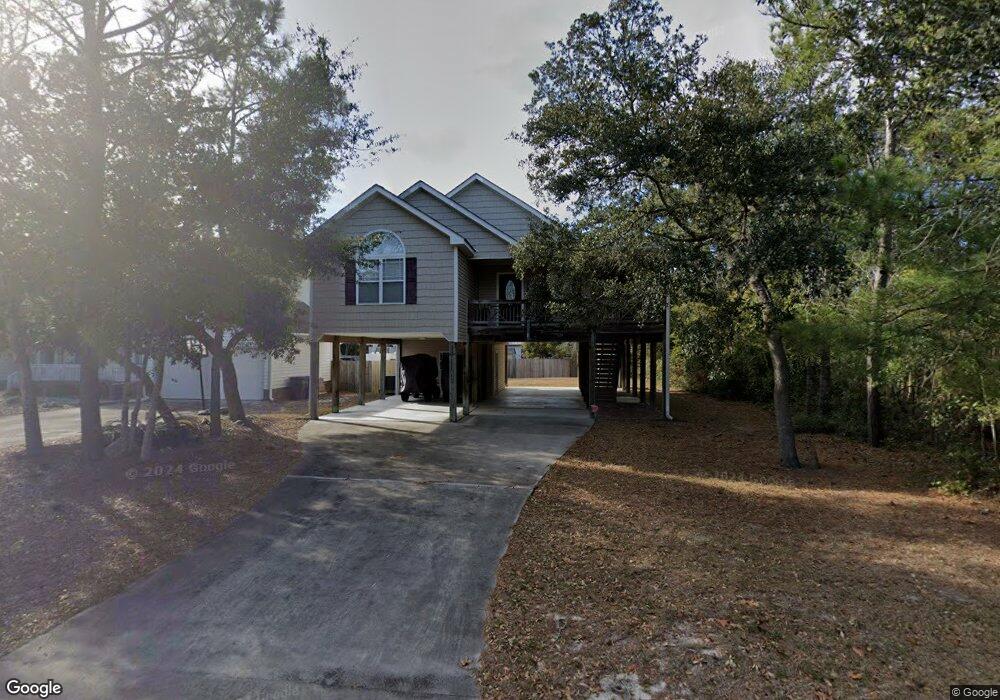
119 NE 39th St Oak Island, NC 28465
Estimated Value: $536,000 - $597,000
3
Beds
2
Baths
1,368
Sq Ft
$416/Sq Ft
Est. Value
About This Home
This home is located at 119 NE 39th St, Oak Island, NC 28465 and is currently estimated at $569,436, approximately $416 per square foot. 119 NE 39th St is a home located in Brunswick County with nearby schools including Southport Elementary School, South Brunswick Middle School, and South Brunswick High School.
Ownership History
Date
Name
Owned For
Owner Type
Purchase Details
Closed on
Aug 3, 2007
Sold by
Morris Chad and Morris Amy
Bought by
Sink Albert F and Sink Becky G
Current Estimated Value
Home Financials for this Owner
Home Financials are based on the most recent Mortgage that was taken out on this home.
Original Mortgage
$267,300
Outstanding Balance
$168,374
Interest Rate
6.56%
Mortgage Type
New Conventional
Estimated Equity
$401,062
Purchase Details
Closed on
Mar 17, 2007
Sold by
Morris Chad and Morris A,Y
Bought by
Morris Chad and Buff Brian Scott
Home Financials for this Owner
Home Financials are based on the most recent Mortgage that was taken out on this home.
Original Mortgage
$245,600
Interest Rate
6.27%
Mortgage Type
Future Advance Clause Open End Mortgage
Create a Home Valuation Report for This Property
The Home Valuation Report is an in-depth analysis detailing your home's value as well as a comparison with similar homes in the area
Home Values in the Area
Average Home Value in this Area
Purchase History
| Date | Buyer | Sale Price | Title Company |
|---|---|---|---|
| Sink Albert F | $297,000 | None Available | |
| Morris Chad | $115,000 | None Available |
Source: Public Records
Mortgage History
| Date | Status | Borrower | Loan Amount |
|---|---|---|---|
| Open | Sink Albert F | $267,300 | |
| Previous Owner | Morris Chad | $245,600 |
Source: Public Records
Tax History Compared to Growth
Tax History
| Year | Tax Paid | Tax Assessment Tax Assessment Total Assessment is a certain percentage of the fair market value that is determined by local assessors to be the total taxable value of land and additions on the property. | Land | Improvement |
|---|---|---|---|---|
| 2025 | -- | $535,170 | $147,000 | $388,170 |
| 2024 | $2,244 | $535,170 | $147,000 | $388,170 |
| 2023 | $1,638 | $535,170 | $147,000 | $388,170 |
| 2022 | $1,638 | $277,720 | $68,000 | $209,720 |
| 2021 | $1,638 | $277,720 | $68,000 | $209,720 |
| 2020 | $1,583 | $277,720 | $68,000 | $209,720 |
| 2019 | $1,583 | $71,360 | $68,000 | $3,360 |
| 2018 | $1,357 | $40,990 | $37,000 | $3,990 |
| 2017 | $1,357 | $40,990 | $37,000 | $3,990 |
| 2016 | $1,332 | $40,990 | $37,000 | $3,990 |
| 2015 | $1,332 | $234,690 | $37,000 | $197,690 |
| 2014 | $1,050 | $196,860 | $45,000 | $151,860 |
Source: Public Records
Map
Nearby Homes
- 129 NE 39th St
- 202 NE 40th St
- 104 NE 40th St
- 104 NE 36th St
- End Road SE 37th St
- 108 NE 41st St
- 214 NE 38th St
- 226 NE 41st St
- 116 NE 35th St
- 314 NE 39th St
- 212 NE 37th St
- 4007 E Oak Island Dr
- 3506 E Oak Island Dr
- 105 SE 37th St
- 210 NE 42nd St
- 108 SE 37th St
- 114 NE 42nd St
- 107 SE 37th St
- 124 NE 34th St
- 317 NE 42nd St