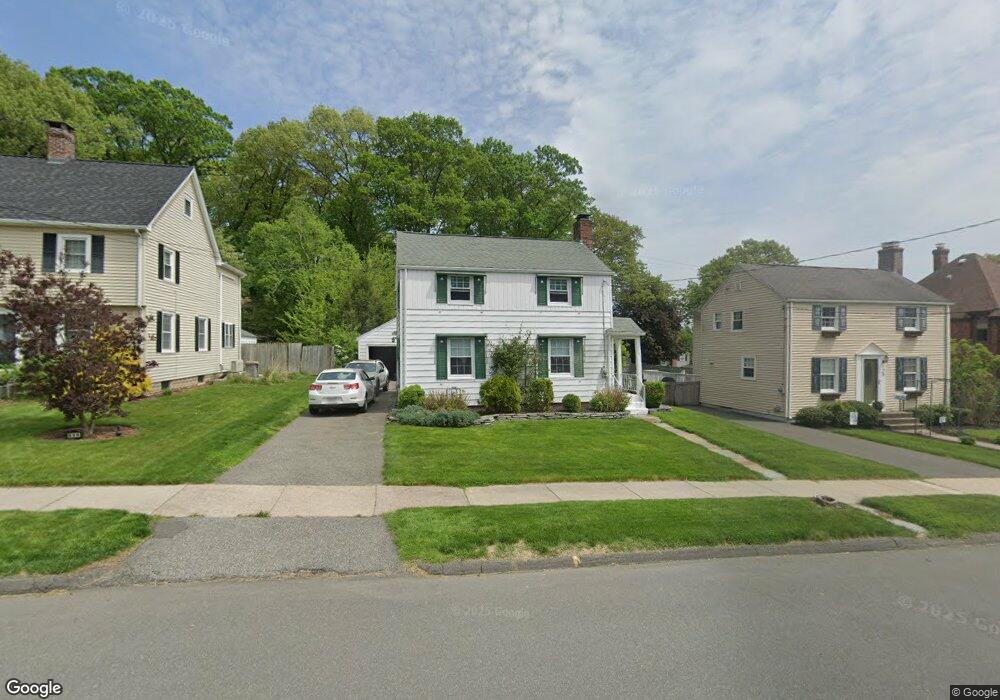
119 Nelson St West Springfield, MA 01089
Estimated Value: $303,000 - $346,000
2
Beds
2
Baths
1,020
Sq Ft
$315/Sq Ft
Est. Value
About This Home
This home is located at 119 Nelson St, West Springfield, MA 01089 and is currently estimated at $321,783, approximately $315 per square foot. 119 Nelson St is a home located in Hampden County with nearby schools including West Springfield High School and St Thomas The Apostle School.
Ownership History
Date
Name
Owned For
Owner Type
Purchase Details
Closed on
Dec 18, 2024
Sold by
Piotrowski Paul and Piotrowski Denise A
Bought by
Mcquade Jamie D and Piotrowski Robert P
Current Estimated Value
Purchase Details
Closed on
Jul 31, 1997
Sold by
Russell Marlene E and Stgermain Nancy E
Bought by
Piotrowski Paul and Piotrowski Denise A
Home Financials for this Owner
Home Financials are based on the most recent Mortgage that was taken out on this home.
Original Mortgage
$88,650
Interest Rate
7.55%
Mortgage Type
Purchase Money Mortgage
Create a Home Valuation Report for This Property
The Home Valuation Report is an in-depth analysis detailing your home's value as well as a comparison with similar homes in the area
Home Values in the Area
Average Home Value in this Area
Purchase History
| Date | Buyer | Sale Price | Title Company |
|---|---|---|---|
| Mcquade Jamie D | -- | None Available | |
| Mcquade Jamie D | -- | None Available | |
| Piotrowski Paul | $98,500 | -- | |
| Piotrowski Paul | $98,500 | -- |
Source: Public Records
Mortgage History
| Date | Status | Borrower | Loan Amount |
|---|---|---|---|
| Previous Owner | Piotrowski Paul | $78,000 | |
| Previous Owner | Piotrowski Paul | $88,650 |
Source: Public Records
Tax History
| Year | Tax Paid | Tax Assessment Tax Assessment Total Assessment is a certain percentage of the fair market value that is determined by local assessors to be the total taxable value of land and additions on the property. | Land | Improvement |
|---|---|---|---|---|
| 2025 | $3,618 | $243,300 | $110,600 | $132,700 |
| 2024 | $3,463 | $233,800 | $110,600 | $123,200 |
| 2023 | $3,383 | $217,700 | $110,600 | $107,100 |
| 2022 | $3,103 | $196,900 | $100,300 | $96,600 |
| 2021 | $2,996 | $177,300 | $93,600 | $83,700 |
| 2020 | $3,131 | $184,300 | $93,600 | $90,700 |
| 2019 | $3,126 | $184,300 | $93,600 | $90,700 |
| 2018 | $3,142 | $184,300 | $93,600 | $90,700 |
| 2017 | $3,142 | $184,300 | $93,600 | $90,700 |
| 2016 | $3,099 | $182,400 | $90,000 | $92,400 |
| 2015 | $3,038 | $178,800 | $88,100 | $90,700 |
| 2014 | $737 | $178,800 | $88,100 | $90,700 |
Source: Public Records
Map
Nearby Homes
Your Personal Tour Guide
Ask me questions while you tour the home.