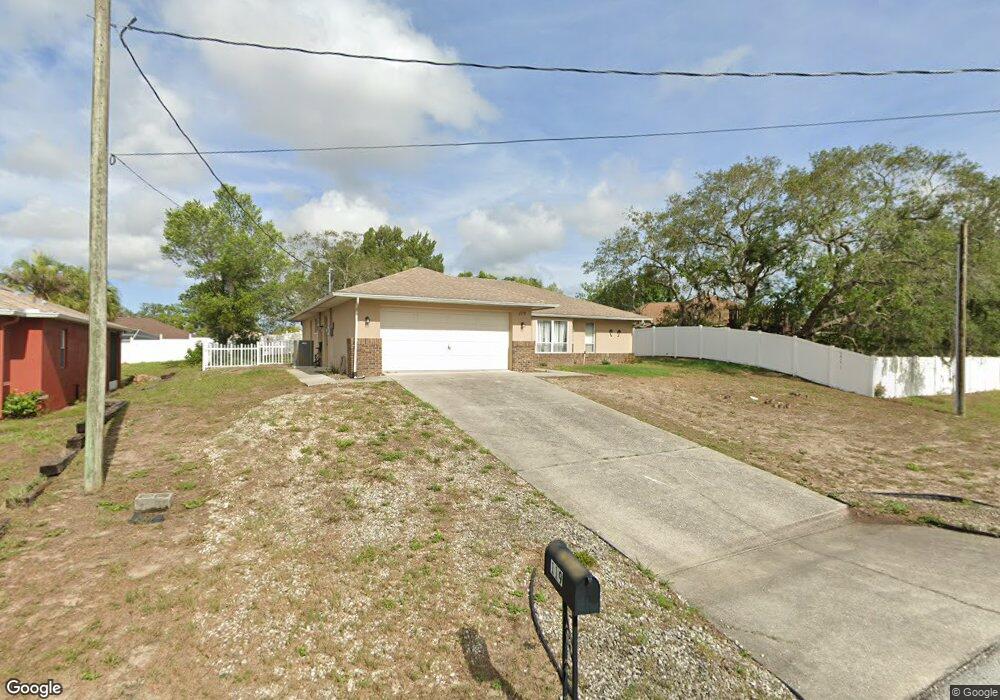
119 Outlook Ave Unit 5 Spring Hill, FL 34606
Estimated Value: $241,000 - $255,000
2
Beds
2
Baths
1,278
Sq Ft
$193/Sq Ft
Est. Value
About This Home
This home is located at 119 Outlook Ave Unit 5, Spring Hill, FL 34606 and is currently estimated at $246,336, approximately $192 per square foot. 119 Outlook Ave Unit 5 is a home located in Hernando County with nearby schools including Westside Elementary School, Fox Chapel Middle School, and Weeki Wachee High School.
Ownership History
Date
Name
Owned For
Owner Type
Purchase Details
Closed on
Aug 25, 2021
Sold by
Camilliti Frank and Camilliti Anne
Bought by
Mortell Elena
Current Estimated Value
Home Financials for this Owner
Home Financials are based on the most recent Mortgage that was taken out on this home.
Original Mortgage
$188,522
Outstanding Balance
$170,415
Interest Rate
2.8%
Mortgage Type
FHA
Estimated Equity
$75,921
Purchase Details
Closed on
May 27, 2014
Sold by
Camilliti Frank
Bought by
Camilliti Frank and Camilliti Anne
Purchase Details
Closed on
Nov 13, 2013
Sold by
Rocamora Mario and Rocamora Reva
Bought by
Camilliti Frank
Home Financials for this Owner
Home Financials are based on the most recent Mortgage that was taken out on this home.
Original Mortgage
$45,000
Interest Rate
4.23%
Mortgage Type
Purchase Money Mortgage
Purchase Details
Closed on
Jul 20, 2001
Sold by
Kopacek Arthur C and Kopacek Dorothy J
Bought by
Harbin B E and Harbin Alta
Create a Home Valuation Report for This Property
The Home Valuation Report is an in-depth analysis detailing your home's value as well as a comparison with similar homes in the area
Home Values in the Area
Average Home Value in this Area
Purchase History
We collect this data history from publicly available records. To have your information removed, we recommend requesting removal directly through your county’s website.
| Date | Buyer | Sale Price | Title Company |
|---|---|---|---|
| Mortell Elena | $192,000 | Southern Security Ttl Of Nat | |
| Camilliti Frank | $20,000 | Attorney | |
| Camilliti Frank | $65,000 | Master Title Services Inc | |
| Harbin B E | $82,500 | -- |
Source: Public Records
Mortgage History
We collect this data history from publicly available records. To have your information removed, we recommend requesting removal directly through your county’s website.
| Date | Status | Borrower | Loan Amount |
|---|---|---|---|
| Open | Mortell Elena | $188,522 | |
| Previous Owner | Camilliti Frank | $45,000 |
Source: Public Records
Tax History
| Year | Tax Paid | Tax Assessment Tax Assessment Total Assessment is a certain percentage of the fair market value that is determined by local assessors to be the total taxable value of land and additions on the property. | Land | Improvement |
|---|---|---|---|---|
| 2025 | $2,927 | $196,003 | -- | -- |
| 2024 | $2,832 | $190,479 | -- | -- |
| 2023 | $2,832 | $184,931 | $0 | $0 |
| 2022 | $2,742 | $179,545 | $23,351 | $156,194 |
| 2021 | $1,738 | $115,672 | $13,280 | $102,392 |
| 2020 | $2,008 | $104,424 | $10,514 | $93,910 |
| 2019 | $1,909 | $94,212 | $10,071 | $84,141 |
| 2018 | $1,198 | $83,101 | $8,300 | $74,801 |
| 2017 | $1,357 | $69,271 | $8,854 | $60,417 |
| 2016 | $1,231 | $61,457 | $0 | $0 |
| 2015 | $1,192 | $58,294 | $0 | $0 |
| 2014 | $1,093 | $55,303 | $0 | $0 |
Source: Public Records
Map
Nearby Homes
- 130 Daroca Ave
- 18801 Orange Hill Dr
- 6101 County Line Rd
- 0 Hallow Ave
- 0 Oneida
- 18735 Rolling Hills Loop
- 18861 Water Lily Ln
- 18711 Rolling Hills Loop
- 101 Parkton Ave
- 5526 Cactus Cir
- 6041 County Line Rd
- 6361 Indian Rock Ct
- 18630 Rolling Hills Loop
- 18721 Water Lily Ln
- 0 Clearwater Dr
- 18902 Grand Club Dr
- 18902 Grand Club Dr Unit Grand Club Dr
- 113 Ruskin Ave
- 12615 Oak Tree Dr
- 134 Galena Ave
- 119 Outlook Ave
- 111 Outlook Ave
- 6340 Clearwater Dr
- 120 Parma Ln
- 128 Parma Ln
- 6249 County Line Rd
- 118 Outlook Ave
- 112 Parma Ln
- 154 Arcadia Ave
- 6356 Clearwater Dr
- 6407 Clearwater Dr
- 138 Parma Ln
- 102 Outlook Ave
- 6339 Clearwater Dr
- 6351 Clearwater Dr
- 115 Parma Ln
- 129 Daroca Ave
- 112 Arcadia Ave
- 142 Arcadia Ave
- 101 Daroca Ave
Your Personal Tour Guide
Ask me questions while you tour the home.