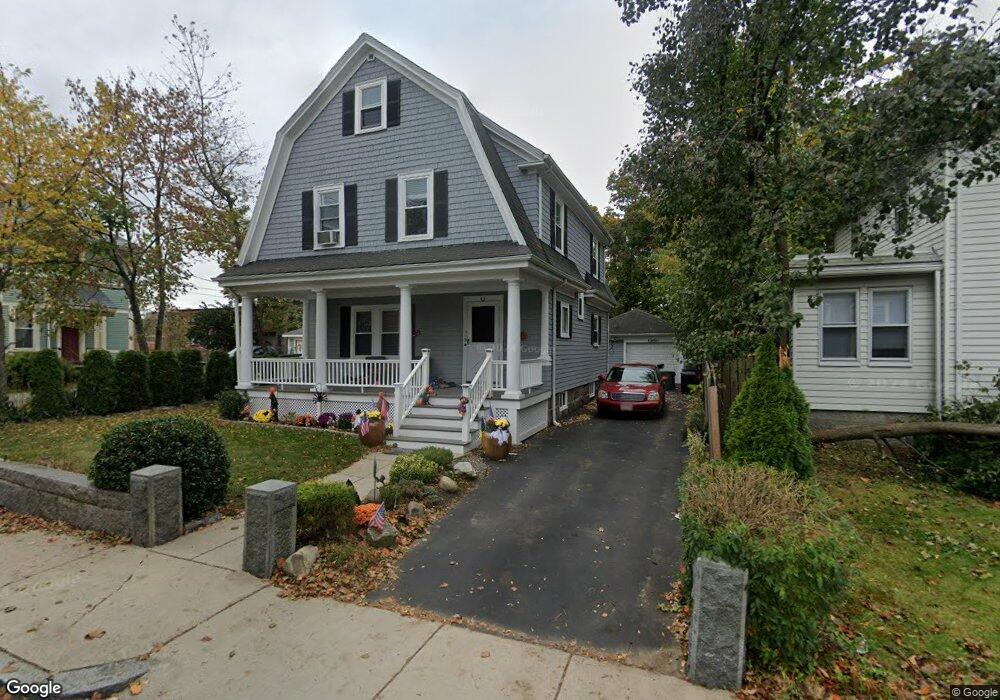
119 Putnam St Quincy, MA 02169
Quincy Center NeighborhoodEstimated Value: $737,000 - $815,723
4
Beds
2
Baths
1,716
Sq Ft
$460/Sq Ft
Est. Value
About This Home
This home is located at 119 Putnam St, Quincy, MA 02169 and is currently estimated at $789,431, approximately $460 per square foot. 119 Putnam St is a home located in Norfolk County with nearby schools including Merrymount Elementary School, Central Middle School, and Quincy High School.
Ownership History
Date
Name
Owned For
Owner Type
Purchase Details
Closed on
Apr 1, 2011
Sold by
Quinn Peter P
Bought by
Quinn Peter P and Quincy Ann
Current Estimated Value
Purchase Details
Closed on
Nov 12, 2010
Sold by
Gallagher William B and Gallagher Ruth M
Bought by
Quinn Peter P
Home Financials for this Owner
Home Financials are based on the most recent Mortgage that was taken out on this home.
Original Mortgage
$316,635
Interest Rate
4.25%
Mortgage Type
FHA
Create a Home Valuation Report for This Property
The Home Valuation Report is an in-depth analysis detailing your home's value as well as a comparison with similar homes in the area
Home Values in the Area
Average Home Value in this Area
Purchase History
| Date | Buyer | Sale Price | Title Company |
|---|---|---|---|
| Quinn Peter P | -- | -- | |
| Quinn Peter P | $330,000 | -- |
Source: Public Records
Mortgage History
| Date | Status | Borrower | Loan Amount |
|---|---|---|---|
| Previous Owner | Quinn Peter P | $316,635 |
Source: Public Records
Tax History
| Year | Tax Paid | Tax Assessment Tax Assessment Total Assessment is a certain percentage of the fair market value that is determined by local assessors to be the total taxable value of land and additions on the property. | Land | Improvement |
|---|---|---|---|---|
| 2025 | $7,697 | $667,600 | $266,900 | $400,700 |
| 2024 | $7,209 | $639,700 | $254,200 | $385,500 |
| 2023 | $6,638 | $596,400 | $231,100 | $365,300 |
| 2022 | $6,948 | $580,000 | $210,100 | $369,900 |
| 2021 | $6,523 | $537,300 | $210,100 | $327,200 |
| 2020 | $6,377 | $513,000 | $200,100 | $312,900 |
| 2019 | $6,226 | $496,100 | $188,800 | $307,300 |
| 2018 | $6,224 | $466,600 | $188,800 | $277,800 |
| 2017 | $6,197 | $437,300 | $179,800 | $257,500 |
| 2016 | $5,880 | $409,500 | $171,200 | $238,300 |
| 2015 | $5,688 | $389,600 | $171,200 | $218,400 |
| 2014 | $5,309 | $357,300 | $163,100 | $194,200 |
Source: Public Records
Map
Nearby Homes
- 1025 Hancock St Unit 6J
- 1025 Hancock St Unit 2K
- 20 Whitney Rd Unit 3
- 20 Whitney Rd Unit 4
- 20 Whitney Rd Unit 1
- 20 Whitney Rd Unit 5
- 20 Whitney Rd Unit 6
- 20 Whitney Rd Unit 2
- 10 Presidents Ln Unit 10
- 105 Sea St Unit 105
- 105 Sea St Unit 102
- 200 Adams St
- 59 Spear St Unit 201
- 59 Spear St Unit 302
- 59 Spear St Unit 202
- 59 Spear St Unit 301
- 66 Mcgrath Hwy Unit 305
- 66 Mcgrath Hwy Unit 411
- 66 Mcgrath Hwy Unit 504
- 66 Mcgrath Hwy Unit 202
- 115 Putnam St
- 115 Putnam St Unit 2
- 109 Putnam St
- 120 Putnam St
- 86 Greenleaf St Unit 202
- 86 Greenleaf St Unit 203
- 86 Greenleaf St Unit 201
- 86 Greenleaf St Unit 204
- 86 Greenleaf St Unit 302
- 86 Greenleaf St Unit 101
- 86 Greenleaf St Unit 303
- 86 Greenleaf St Unit 301
- 86 Greenleaf St Unit 304
- 103 Putnam St
- 116 Putnam St
- 43 Merrymount Rd Unit 9
- 43 Merrymount Rd Unit 8
- 43 Merrymount Rd Unit 7
- 43 Merrymount Rd Unit 6
- 43 Merrymount Rd Unit 5