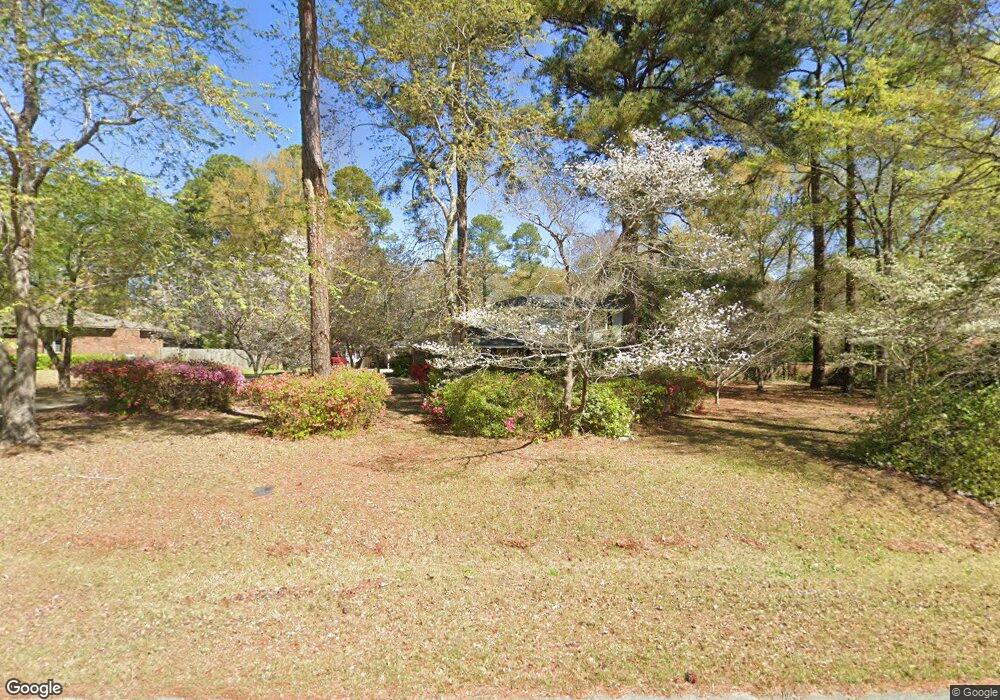
119 Quail Run Dr Warner Robins, GA 31088
Estimated Value: $330,000 - $361,000
4
Beds
3
Baths
2,766
Sq Ft
$125/Sq Ft
Est. Value
About This Home
This home is located at 119 Quail Run Dr, Warner Robins, GA 31088 and is currently estimated at $345,750, approximately $125 per square foot. 119 Quail Run Dr is a home located in Houston County with nearby schools including Quail Run Elementary School, Thomson Middle School, and Northside High School.
Ownership History
Date
Name
Owned For
Owner Type
Purchase Details
Closed on
Sep 27, 2021
Sold by
Sheffield Steven C
Bought by
Sheffield Tiffany E
Current Estimated Value
Purchase Details
Closed on
Aug 18, 2011
Sold by
Morris Thomas C and Morris Sue Gail
Bought by
Sheffield Steven C and Sheffield Tiffany E
Home Financials for this Owner
Home Financials are based on the most recent Mortgage that was taken out on this home.
Original Mortgage
$175,339
Outstanding Balance
$119,047
Interest Rate
4.54%
Mortgage Type
FHA
Estimated Equity
$226,703
Purchase Details
Closed on
Jul 12, 2002
Sold by
Scuderi Margaret J
Bought by
Morris Thomas C and Sue Gail
Purchase Details
Closed on
Sep 7, 1979
Sold by
Bittorie John H and Bittorie Glenda K
Bought by
Scuderi Richard and Scuderi Margaret J
Purchase Details
Closed on
Jun 13, 1975
Sold by
Byrd Robert S and Mcneal Larry M
Bought by
Bittorie John H and Bittorie Glenda K
Create a Home Valuation Report for This Property
The Home Valuation Report is an in-depth analysis detailing your home's value as well as a comparison with similar homes in the area
Home Values in the Area
Average Home Value in this Area
Purchase History
| Date | Buyer | Sale Price | Title Company |
|---|---|---|---|
| Sheffield Tiffany E | -- | None Available | |
| Sheffield Steven C | $179,900 | None Available | |
| Morris Thomas C | $169,900 | -- | |
| Scuderi Margaret J | -- | -- | |
| Scuderi Richard | -- | -- | |
| Bittorie John H | -- | -- |
Source: Public Records
Mortgage History
| Date | Status | Borrower | Loan Amount |
|---|---|---|---|
| Open | Sheffield Steven C | $175,339 |
Source: Public Records
Tax History
| Year | Tax Paid | Tax Assessment Tax Assessment Total Assessment is a certain percentage of the fair market value that is determined by local assessors to be the total taxable value of land and additions on the property. | Land | Improvement |
|---|---|---|---|---|
| 2025 | $2,669 | $122,160 | $12,000 | $110,160 |
| 2024 | $2,795 | $116,840 | $12,000 | $104,840 |
| 2023 | $2,240 | $92,680 | $12,000 | $80,680 |
| 2022 | $2,021 | $83,600 | $11,200 | $72,400 |
| 2021 | $1,882 | $77,480 | $11,200 | $66,280 |
| 2020 | $1,698 | $69,560 | $11,200 | $58,360 |
| 2019 | $1,698 | $69,560 | $11,200 | $58,360 |
| 2018 | $1,698 | $69,560 | $11,200 | $58,360 |
| 2017 | $1,700 | $69,560 | $11,200 | $58,360 |
| 2016 | $1,702 | $69,560 | $11,200 | $58,360 |
| 2015 | $1,706 | $69,560 | $11,200 | $58,360 |
| 2014 | -- | $69,560 | $11,200 | $58,360 |
| 2013 | -- | $69,560 | $11,200 | $58,360 |
Source: Public Records
Map
Nearby Homes
- 102 Smoke Rise Dr
- 101 Joy Dr
- 112 Scotsburg Dr
- 116 Joy Dr
- 515 Quail Run Dr
- 511 Pheasant Ridge Dr
- 322 Pheasant Ridge Dr
- 111 Glacier Trail
- 407 Smoke Rise Dr
- 114 Wavertree Dr
- 122 Emberly Ln
- 301 Bowen Dr
- 234 Sedgebrooke Dr
- 122 Wavertree Dr
- 103 Emberly Ln
- 307 Pheasant Ridge Dr
- 205 Bowen Dr
- 305 Empire Trail
- 312 Davids Place Dr
- 310 Davids Place Dr
- 121 Quail Run Dr
- 117 Quail Run Dr
- 309 Cliff Howard Dr
- 305 Cliff Howard Dr
- 102 Barrington Place S
- 313 Cliff Howard Dr
- 123 Quail Run Dr
- 116 Quail Run Dr
- 102 Barrington Place N
- 317 Cliff Howard Dr
- 115 Quail Run Dr
- 104 Barrington Place S
- 118 Quail Run Dr
- 114 Quail Run Dr
- 100 Barrington Place S
- 321 Cliff Howard Dr
- 308 Cliff Howard Dr
- 105 Barrington Place S
- 120 Quail Run Dr
- 112 Quail Run Dr
Your Personal Tour Guide
Ask me questions while you tour the home.