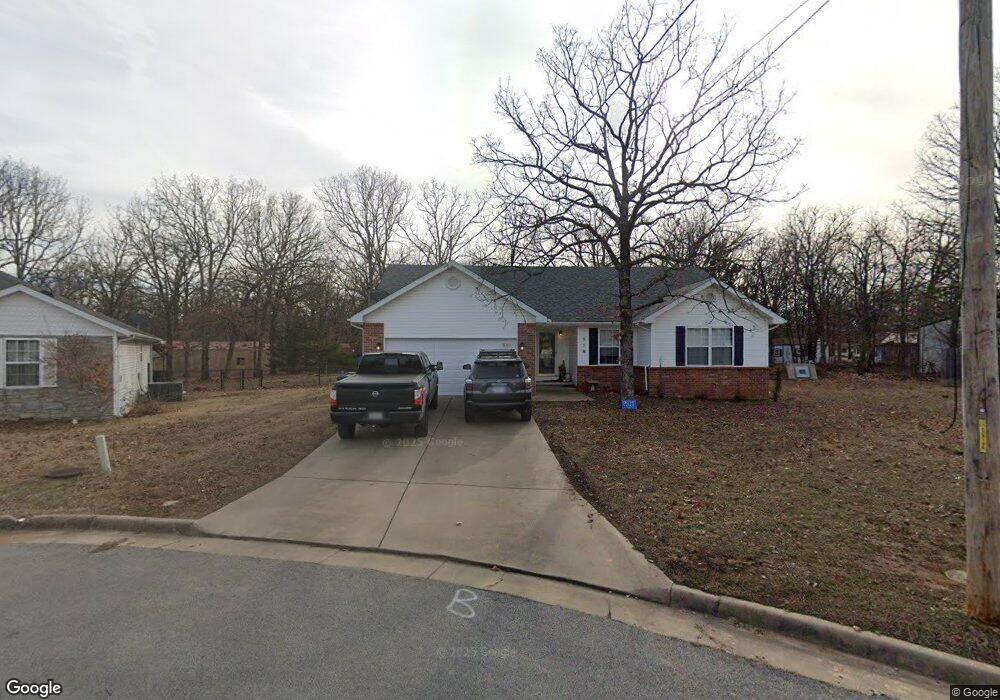
119 Randolph Dr Carl Junction, MO 64834
Estimated Value: $270,000 - $320,461
3
Beds
2
Baths
1,922
Sq Ft
$158/Sq Ft
Est. Value
About This Home
This home is located at 119 Randolph Dr, Carl Junction, MO 64834 and is currently estimated at $303,115, approximately $157 per square foot. 119 Randolph Dr is a home located in Jasper County with nearby schools including Carl Junction Primary School (K-1), Carl Junction Intermediate School, and Carl Junction Primary School (2-3).
Ownership History
Date
Name
Owned For
Owner Type
Purchase Details
Closed on
Feb 17, 2017
Sold by
Clark Clinton H
Bought by
Berry Sarah May and Berry Jason L
Current Estimated Value
Home Financials for this Owner
Home Financials are based on the most recent Mortgage that was taken out on this home.
Original Mortgage
$114,880
Outstanding Balance
$95,419
Interest Rate
4.4%
Mortgage Type
FHA
Estimated Equity
$207,696
Purchase Details
Closed on
Oct 28, 2009
Sold by
Mortgage Asset Recovery Inc
Bought by
Clark Clinton H
Home Financials for this Owner
Home Financials are based on the most recent Mortgage that was taken out on this home.
Original Mortgage
$88,420
Interest Rate
5.05%
Mortgage Type
FHA
Purchase Details
Closed on
May 22, 2009
Sold by
Mortgage Electronic Registration Systems
Bought by
Mortgage Asset Recovery Inc
Purchase Details
Closed on
Apr 17, 2007
Sold by
Rivera Noemi
Bought by
Mortgage Electronic Registration Systems
Create a Home Valuation Report for This Property
The Home Valuation Report is an in-depth analysis detailing your home's value as well as a comparison with similar homes in the area
Purchase History
| Date | Buyer | Sale Price | Title Company |
|---|---|---|---|
| Berry Sarah May | -- | None Available | |
| Clark Clinton H | -- | Abbey | |
| Mortgage Asset Recovery Inc | -- | Abbey | |
| Mortgage Electronic Registration Systems | $100,414 | None Available |
Source: Public Records
Mortgage History
| Date | Status | Borrower | Loan Amount |
|---|---|---|---|
| Open | Berry Sarah May | $114,880 | |
| Previous Owner | Clark Clinton H | $88,420 |
Source: Public Records
Tax History
| Year | Tax Paid | Tax Assessment Tax Assessment Total Assessment is a certain percentage of the fair market value that is determined by local assessors to be the total taxable value of land and additions on the property. | Land | Improvement |
|---|---|---|---|---|
| 2025 | $2,020 | $38,630 | $6,460 | $32,170 |
| 2024 | $2,033 | $34,530 | $6,460 | $28,070 |
| 2023 | $2,033 | $34,530 | $6,460 | $28,070 |
| 2022 | $2,043 | $34,600 | $6,460 | $28,140 |
| 2021 | $1,752 | $34,600 | $6,460 | $28,140 |
| 2020 | $1,656 | $32,130 | $6,460 | $25,670 |
| 2019 | $1,572 | $32,130 | $6,460 | $25,670 |
| 2018 | $1,693 | $34,690 | $0 | $0 |
| 2017 | $1,697 | $34,690 | $0 | $0 |
| 2016 | $1,716 | $35,410 | $0 | $0 |
Source: Public Records
Map
Nearby Homes
- 123 Rocky Ln
- 25122 Gum Rd
- 401 Dogwood Trails Loop
- 121 Forest Dr
- 112 Red Oak Dr
- 6548 Mo-171
- 25452 Leffen Ln
- 2626 Joplin St
- 5981 Pearl St
- Lot 1B Hwy 171 & Fir Rd
- Lot 1A Hwy 171 & Fir Rd
- Xxx Wall St
- Lot 1 Hwy 171 & Fir Rd
- XXX Lone Elm
- LOT 4C Hwy 171 & Fir Rd Unit 4C
- Lot 14 Brenden Ln
- TBD Wall St
- Lot 15 Jada Creek Estates
- 825 Colonial Dr
- 1061/1077 Gavin Jett Pkwy
- 121 Randolph Dr
- 0 State Highway 43
- 125 Randolph Dr
- 115 Rocky Ln
- 115 Rocky Ln Unit 1
- 117 Randolph Dr
- 114 Randolph Dr
- 115 Randolph Dr
- 112 Randolph Dr
- 110 Randolph Dr
- 209 Gum Rd
- 108 Randolph Dr
- 113 Randolph Dr
- 207 Gum Rd
- 117 Rocky Ln
- 107 Randolph Dr
- 105 Randolph Dr
- 205 Gum Rd
- 107 Kellie Ln
- 103 Randolph Dr
Your Personal Tour Guide
Ask me questions while you tour the home.