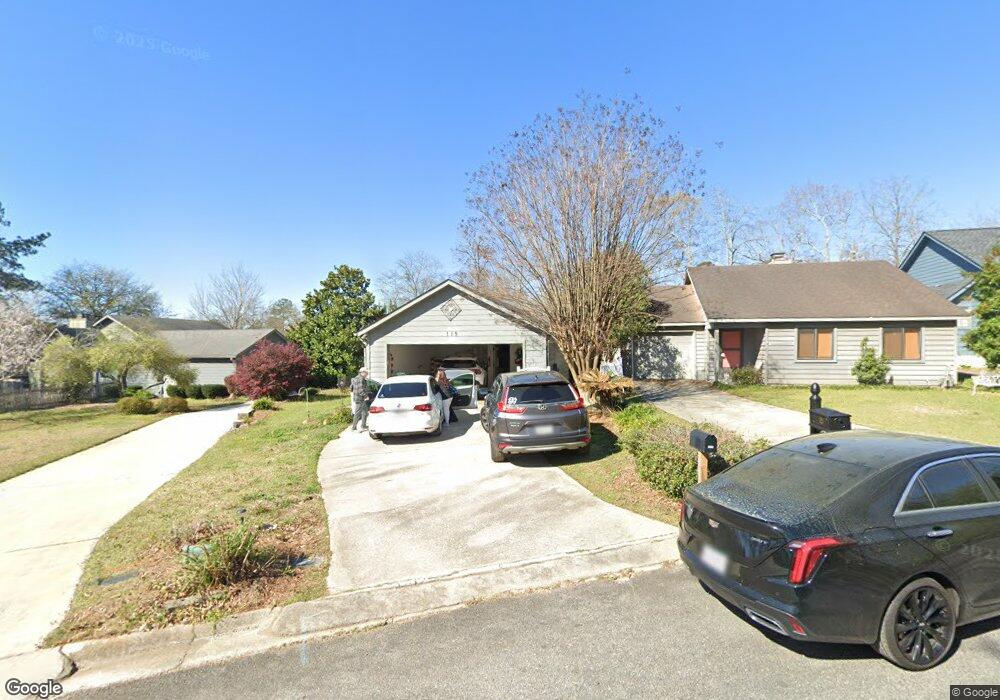
119 Ridge Pointe Ct Warner Robins, GA 31088
Estimated Value: $156,000 - $166,000
2
Beds
2
Baths
1,197
Sq Ft
$134/Sq Ft
Est. Value
About This Home
This home is located at 119 Ridge Pointe Ct, Warner Robins, GA 31088 and is currently estimated at $160,396, approximately $133 per square foot. 119 Ridge Pointe Ct is a home located in Houston County with nearby schools including Russell Elementary School, Huntington Middle School, and Warner Robins High School.
Ownership History
Date
Name
Owned For
Owner Type
Purchase Details
Closed on
Aug 29, 2016
Sold by
James H
Bought by
Brewer Wendy L
Current Estimated Value
Home Financials for this Owner
Home Financials are based on the most recent Mortgage that was taken out on this home.
Original Mortgage
$90,824
Outstanding Balance
$71,478
Interest Rate
3.48%
Mortgage Type
FHA
Estimated Equity
$88,918
Purchase Details
Closed on
Mar 31, 1997
Sold by
Antebellum Builders Inc
Bought by
Willis James H and Marilind E*
Purchase Details
Closed on
Aug 26, 1994
Sold by
Antebellum Builders Inc
Bought by
Mcwhirter Kathleen B
Purchase Details
Closed on
Mar 23, 1993
Sold by
Antebellum South Inc
Bought by
Antebellum Builders Inc
Purchase Details
Closed on
Aug 4, 1992
Sold by
First Denver Investment Corp
Bought by
Antebellum South Inc
Create a Home Valuation Report for This Property
The Home Valuation Report is an in-depth analysis detailing your home's value as well as a comparison with similar homes in the area
Home Values in the Area
Average Home Value in this Area
Purchase History
| Date | Buyer | Sale Price | Title Company |
|---|---|---|---|
| Brewer Wendy L | $92,500 | -- | |
| Willis James H | $75,500 | -- | |
| Mcwhirter Kathleen B | $65,000 | -- | |
| Antebellum Builders Inc | $6,500 | -- | |
| Antebellum South Inc | -- | -- |
Source: Public Records
Mortgage History
| Date | Status | Borrower | Loan Amount |
|---|---|---|---|
| Open | Brewer Wendy L | $90,824 |
Source: Public Records
Tax History
| Year | Tax Paid | Tax Assessment Tax Assessment Total Assessment is a certain percentage of the fair market value that is determined by local assessors to be the total taxable value of land and additions on the property. | Land | Improvement |
|---|---|---|---|---|
| 2025 | $1,434 | $52,960 | $4,400 | $48,560 |
| 2024 | $1,561 | $49,080 | $4,400 | $44,680 |
| 2023 | $1,299 | $40,800 | $4,400 | $36,400 |
| 2022 | $857 | $39,280 | $4,400 | $34,880 |
| 2021 | $767 | $35,160 | $4,400 | $30,760 |
| 2020 | $770 | $35,160 | $4,400 | $30,760 |
| 2019 | $817 | $35,160 | $4,400 | $30,760 |
| 2018 | $817 | $35,160 | $4,400 | $30,760 |
| 2017 | $818 | $35,160 | $4,400 | $30,760 |
| 2016 | $146 | $35,160 | $4,400 | $30,760 |
| 2015 | -- | $35,160 | $4,400 | $30,760 |
| 2014 | -- | $35,160 | $4,400 | $30,760 |
| 2013 | -- | $35,160 | $4,400 | $30,760 |
Source: Public Records
Map
Nearby Homes
- 102 Tallulah Trail
- 122 Tallulah Trail
- 105 Ridge Pointe Ct
- 236 Tallulah Trail
- 301 Lake Front Dr
- 209 Lake Front Dr
- 107 Pheasant Cove
- 107 Woodfield Dr
- 103 Shenandoah Trail
- 226 Shenandoah Trail
- 220 Station Way
- 314 Air View Dr
- 217 Station Way
- 223 Highland Dr
- 305 Bonnie Dr
- 120 Shenandoah Trail
- 105 Marvin Blvd
- 134 Shenandoah Trail
- 201 Bayside Dr
- 101 Sunnybrook Ct
- 121 Ridge Pointe Ct
- 117 Ridge Pointe Ct
- 123 Ridge Pointe Ct
- 113 Ridge Pointe Ct
- 125 Ridge Pointe Ct
- 118 Ridge Pointe Ct
- 111 Ridge Pointe Ct
- 127 Ridge Pointe Ct
- 108 Ridge Pointe Ct
- 100 Tallulah Trail
- 114 Tallulah Trail
- 116 Tallulah Trail
- 104 Tallulah Trail
- 109 Ridge Pointe Ct
- 129 Ridge Pointe Ct
- 106 Tallulah Trail
- 118 Tallulah Trail
- 120 Ridge Pointe Ct
- 104 Ridge Pointe Ct
- 112 Tallulah Trail
Your Personal Tour Guide
Ask me questions while you tour the home.