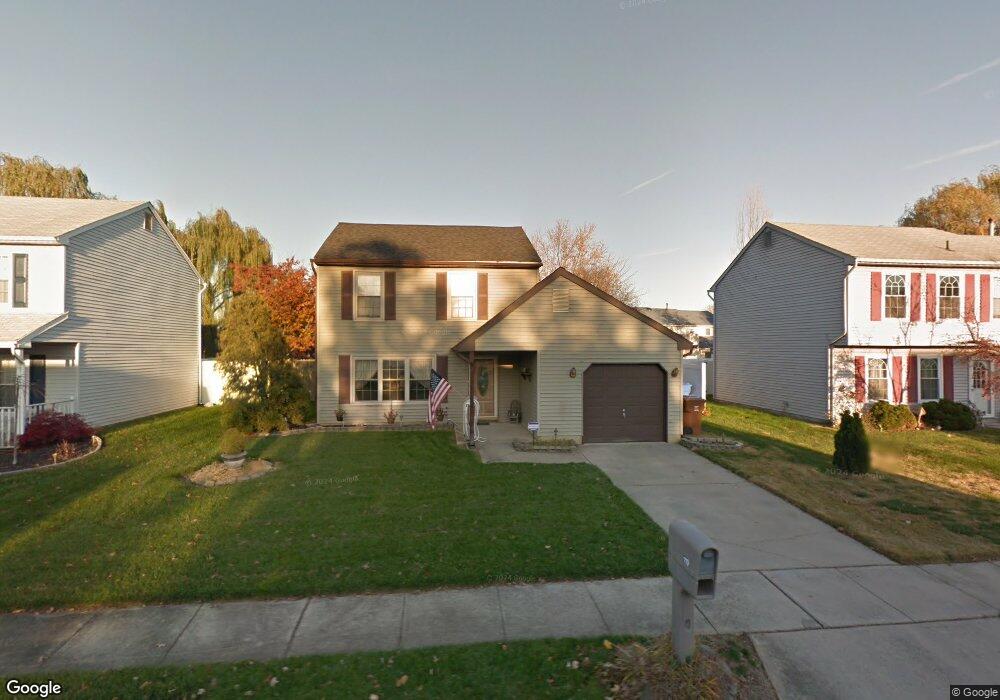
119 Robins Run W Swedesboro, NJ 08085
Logan Township NeighborhoodEstimated Value: $374,619 - $482,000
3
Beds
2
Baths
1,804
Sq Ft
$231/Sq Ft
Est. Value
About This Home
This home is located at 119 Robins Run W, Swedesboro, NJ 08085 and is currently estimated at $417,155, approximately $231 per square foot. 119 Robins Run W is a home located in Gloucester County with nearby schools including Logan Township Elementary School.
Ownership History
Date
Name
Owned For
Owner Type
Purchase Details
Closed on
Oct 13, 2006
Sold by
Ayers Shelley
Bought by
Stephen Blessing
Current Estimated Value
Home Financials for this Owner
Home Financials are based on the most recent Mortgage that was taken out on this home.
Original Mortgage
$173,000
Outstanding Balance
$103,404
Interest Rate
6.49%
Mortgage Type
Purchase Money Mortgage
Estimated Equity
$313,751
Purchase Details
Closed on
Sep 9, 2004
Sold by
Nunan William A and Nunan Kathleen
Bought by
Ayers Stephen A and Ayers Shelly R
Home Financials for this Owner
Home Financials are based on the most recent Mortgage that was taken out on this home.
Original Mortgage
$189,905
Interest Rate
6.08%
Mortgage Type
Purchase Money Mortgage
Purchase Details
Closed on
Jul 10, 1998
Sold by
Harbridge William B and Harbridge Carol G
Bought by
Nunan William A and Nunan Kathleen
Home Financials for this Owner
Home Financials are based on the most recent Mortgage that was taken out on this home.
Original Mortgage
$119,990
Interest Rate
7.02%
Mortgage Type
FHA
Create a Home Valuation Report for This Property
The Home Valuation Report is an in-depth analysis detailing your home's value as well as a comparison with similar homes in the area
Home Values in the Area
Average Home Value in this Area
Purchase History
| Date | Buyer | Sale Price | Title Company |
|---|---|---|---|
| Stephen Blessing | $245,000 | -- | |
| Ayers Stephen A | $199,900 | Group 21 | |
| Nunan William A | $121,000 | Congress Title Corp |
Source: Public Records
Mortgage History
| Date | Status | Borrower | Loan Amount |
|---|---|---|---|
| Open | Stephen Blessing | $173,000 | |
| Previous Owner | Ayers Stephen A | $189,905 | |
| Previous Owner | Nunan William A | $119,990 |
Source: Public Records
Tax History Compared to Growth
Tax History
| Year | Tax Paid | Tax Assessment Tax Assessment Total Assessment is a certain percentage of the fair market value that is determined by local assessors to be the total taxable value of land and additions on the property. | Land | Improvement |
|---|---|---|---|---|
| 2025 | $3,882 | $298,600 | $65,600 | $233,000 |
| 2024 | $4,322 | $298,600 | $65,600 | $233,000 |
| 2023 | $4,322 | $215,000 | $53,400 | $161,600 |
| 2022 | $4,491 | $215,000 | $53,400 | $161,600 |
| 2021 | $3,496 | $215,000 | $53,400 | $161,600 |
| 2020 | $4,676 | $215,000 | $53,400 | $161,600 |
| 2019 | $4,670 | $215,000 | $53,400 | $161,600 |
| 2018 | $4,541 | $215,000 | $53,400 | $161,600 |
| 2017 | $4,635 | $184,900 | $47,000 | $137,900 |
| 2016 | $4,560 | $184,900 | $47,000 | $137,900 |
| 2015 | $4,031 | $184,900 | $47,000 | $137,900 |
| 2014 | $3,909 | $184,900 | $47,000 | $137,900 |
Source: Public Records
Map
Nearby Homes
- 128 Robins Run W
- 144 Robins Run W
- 18 Dogwood Place
- 23 Adams St
- 111 Peachwood Dr
- 209 Windsor Dr
- 229 Westbrook Dr
- 55 Hamilton St
- 120 Edward Dr
- 60 Pedricktown Woodstown Rd
- 112 Carriage Ln
- 328 Pedricktown Rd
- 9 Brattleboro Rd
- 217 Spruce Trail
- 47 E Mill St
- 13 Sweet Bay Ln
- 142 Ramona Ln
- 17 Hickory Ln
- 135 Juniper Ln
- 203 Amesbury Blvd
- 117 Robins Run W
- 121 Robins Run W
- 104 Goldfinch Ct
- 123 Robins Run W
- 106 Goldfinch Ct
- 115 Robins Run W
- 132 Robins Run W
- 130 Robins Run W
- 113 Robins Run W
- 102 Goldfinch Ct
- 134 Robins Run W
- 125 Robins Run W
- 111 Robins Run W
- 136 Robins Run W
- 107 Goldfinch Ct
- 126 Robins Run W
- 100 Goldfinch Ct
- 127 Robins Run W
- 124 Robins Run W
- 109 Robins Run W