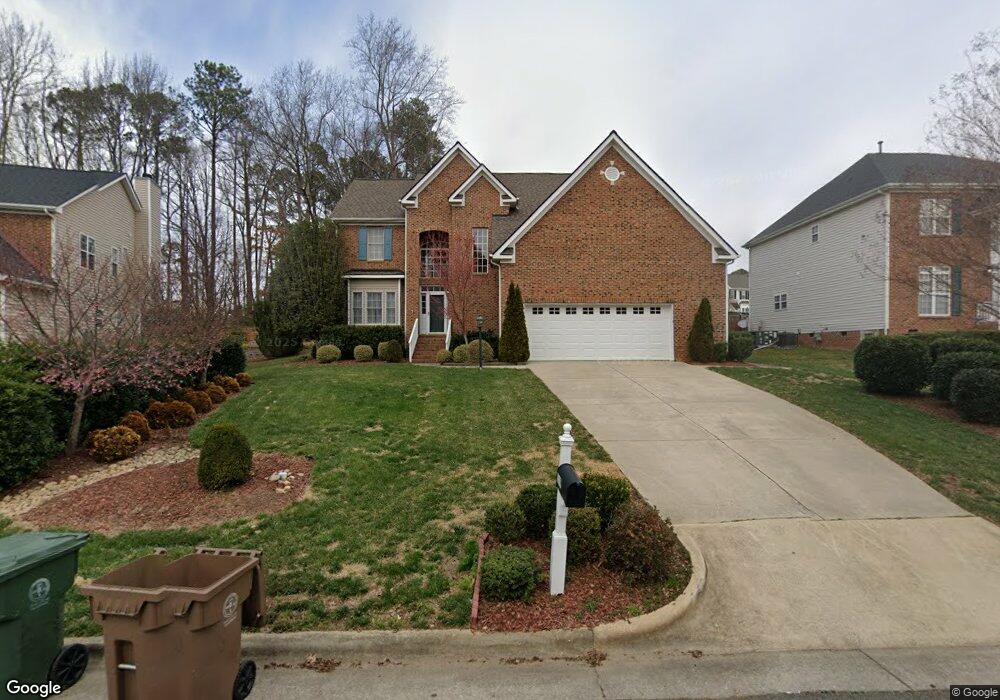
119 Running Creek Rd Cary, NC 27518
Middle Creek NeighborhoodEstimated Value: $674,000 - $771,000
5
Beds
3
Baths
2,659
Sq Ft
$266/Sq Ft
Est. Value
About This Home
This home is located at 119 Running Creek Rd, Cary, NC 27518 and is currently estimated at $707,869, approximately $266 per square foot. 119 Running Creek Rd is a home located in Wake County with nearby schools including Oak Grove Elementary, Lufkin Road Middle School, and TMSA Triangle - Triangle Math and Science Academy.
Ownership History
Date
Name
Owned For
Owner Type
Purchase Details
Closed on
Nov 13, 2014
Sold by
Barr Scott A and Barr Sandra J
Bought by
Storts Daniel and Storts Julie
Current Estimated Value
Home Financials for this Owner
Home Financials are based on the most recent Mortgage that was taken out on this home.
Original Mortgage
$287,000
Outstanding Balance
$223,833
Interest Rate
4.5%
Mortgage Type
Adjustable Rate Mortgage/ARM
Estimated Equity
$484,036
Purchase Details
Closed on
Apr 6, 2006
Sold by
Dowling John H and Dowling Kelly M
Bought by
Barr Scott A and Barr Sandra J
Home Financials for this Owner
Home Financials are based on the most recent Mortgage that was taken out on this home.
Original Mortgage
$251,120
Interest Rate
6.23%
Mortgage Type
Purchase Money Mortgage
Purchase Details
Closed on
Jul 28, 1999
Sold by
Dowling John H
Bought by
Dowling John H and Dowling Kelly M
Purchase Details
Closed on
Jan 27, 1998
Sold by
The New Fortis Corp
Bought by
Degner Timothy H and Degner Julie L
Create a Home Valuation Report for This Property
The Home Valuation Report is an in-depth analysis detailing your home's value as well as a comparison with similar homes in the area
Home Values in the Area
Average Home Value in this Area
Purchase History
| Date | Buyer | Sale Price | Title Company |
|---|---|---|---|
| Storts Daniel | $300,000 | None Available | |
| Barr Scott A | $314,000 | None Available | |
| Dowling John H | -- | -- | |
| Dowling John H | $233,500 | -- | |
| Degner Timothy H | $237,500 | -- |
Source: Public Records
Mortgage History
| Date | Status | Borrower | Loan Amount |
|---|---|---|---|
| Open | Storts Daniel | $287,000 | |
| Previous Owner | Barr Scott A | $251,120 | |
| Previous Owner | Barr Scott A | $62,780 |
Source: Public Records
Tax History Compared to Growth
Tax History
| Year | Tax Paid | Tax Assessment Tax Assessment Total Assessment is a certain percentage of the fair market value that is determined by local assessors to be the total taxable value of land and additions on the property. | Land | Improvement |
|---|---|---|---|---|
| 2025 | $5,785 | $672,634 | $210,000 | $462,634 |
| 2024 | $5,660 | $672,634 | $210,000 | $462,634 |
| 2023 | $3,975 | $394,756 | $85,000 | $309,756 |
| 2022 | $3,827 | $394,756 | $85,000 | $309,756 |
| 2021 | $3,750 | $394,756 | $85,000 | $309,756 |
| 2020 | $3,770 | $394,756 | $85,000 | $309,756 |
| 2019 | $3,603 | $334,653 | $92,000 | $242,653 |
| 2018 | $3,381 | $334,653 | $92,000 | $242,653 |
| 2017 | $3,249 | $334,653 | $92,000 | $242,653 |
| 2016 | $3,201 | $334,653 | $92,000 | $242,653 |
| 2015 | $3,266 | $329,736 | $92,000 | $237,736 |
| 2014 | $3,080 | $329,736 | $92,000 | $237,736 |
Source: Public Records
Map
Nearby Homes
- 203 Crickentree Dr
- 103 Moss Rose Ct
- 102 Forest Edge Dr
- 10917 Bexhill Dr
- 104 Langston Mill Ct
- 201 Piperwood Dr
- 204 Oxford Mill Ct
- 101 Saint Brides Ct
- 103 Glenbrae Ct
- 612 Hawks Ridge Ct
- 200 Lions Gate Dr
- 101 Lions Gate Dr
- 313 Mount Eden Place
- 103 Glenstone Ln
- 114 Kendleton Place
- 401 Felspar Way
- 116 N Fern Abbey Ln
- 107 Sonoma Valley Dr
- 207 Devonbrook Ln
- 107 Quarter Path
- 121 Running Creek Rd
- 117 Running Creek Rd
- 103 Fox Squirrel Ct
- 118 Running Creek Rd
- 115 Running Creek Rd
- 200 Running Creek Rd
- 120 Running Creek Rd
- 105 Fox Squirrel Ct
- 100 Fox Squirrel Ct
- 102 Fox Squirrel Ct
- 107 Fox Squirrel Ct
- 108 Running Creek Rd
- 102 Placid Place
- 101 Placid Place
- 104 Fox Squirrel Ct
- 106 Fox Squirrel Ct
- 106 Fox Squirell
- 111 Running Creek Rd
- 203 Running Creek Rd
- 103 Placid Place