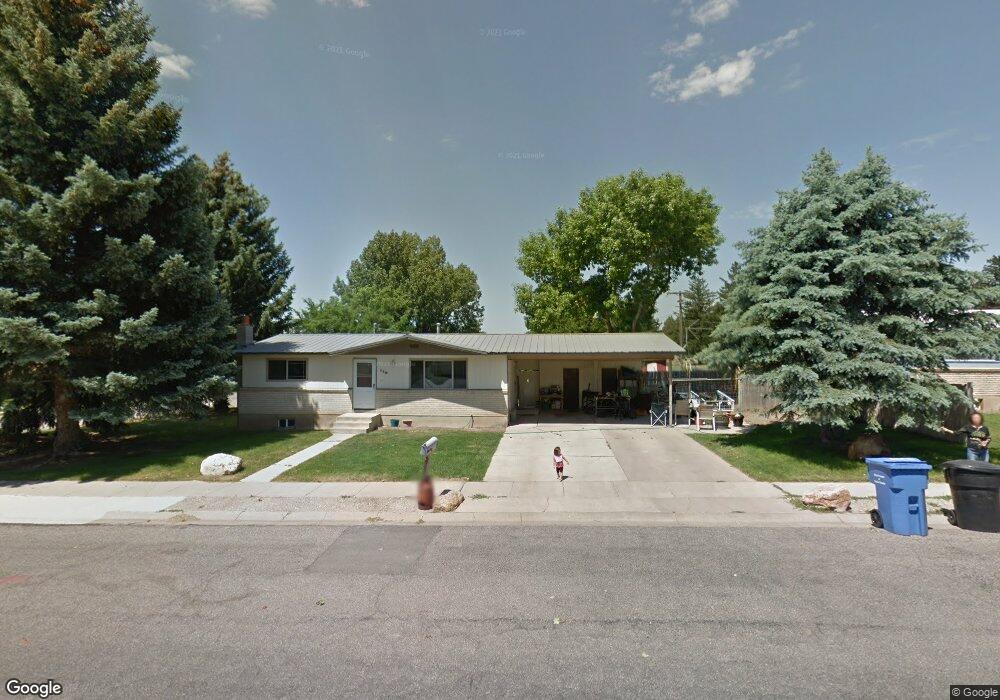
119 S 455 E Smithfield, UT 84335
Estimated Value: $336,750 - $384,000
Studio
--
Bath
912
Sq Ft
$402/Sq Ft
Est. Value
About This Home
This home is located at 119 S 455 E, Smithfield, UT 84335 and is currently estimated at $366,938, approximately $402 per square foot. 119 S 455 E is a home with nearby schools including Sunrise School, Cedar Ridge School, and North Cache Middle School.
Ownership History
Date
Name
Owned For
Owner Type
Purchase Details
Closed on
Feb 3, 2022
Sold by
Richardson Toledo
Bought by
Toledo Skyler D and Toledo Tori H
Current Estimated Value
Home Financials for this Owner
Home Financials are based on the most recent Mortgage that was taken out on this home.
Original Mortgage
$140,000
Outstanding Balance
$129,004
Interest Rate
3.55%
Mortgage Type
New Conventional
Estimated Equity
$237,934
Purchase Details
Closed on
Feb 25, 2013
Sold by
Toledo Richardson
Bought by
Toledo Richardson
Home Financials for this Owner
Home Financials are based on the most recent Mortgage that was taken out on this home.
Original Mortgage
$103,600
Interest Rate
3.34%
Mortgage Type
New Conventional
Purchase Details
Closed on
Aug 1, 2005
Sold by
Toledo Isabelle
Bought by
Toledo Richardson
Create a Home Valuation Report for This Property
The Home Valuation Report is an in-depth analysis detailing your home's value as well as a comparison with similar homes in the area
Home Values in the Area
Average Home Value in this Area
Purchase History
| Date | Buyer | Sale Price | Title Company |
|---|---|---|---|
| Toledo Skyler D | -- | Pinnacle Title | |
| Toledo Richardson | -- | Hickman Land Title Company | |
| Toledo Richardson | -- | Cache Title Company |
Source: Public Records
Mortgage History
| Date | Status | Borrower | Loan Amount |
|---|---|---|---|
| Open | Toledo Skyler D | $140,000 | |
| Previous Owner | Toledo Richardson | $103,600 |
Source: Public Records
Tax History
| Year | Tax Paid | Tax Assessment Tax Assessment Total Assessment is a certain percentage of the fair market value that is determined by local assessors to be the total taxable value of land and additions on the property. | Land | Improvement |
|---|---|---|---|---|
| 2025 | $1,355 | $181,400 | $0 | $0 |
| 2024 | $1,302 | $163,475 | $0 | $0 |
| 2023 | $1,357 | $161,185 | $0 | $0 |
| 2022 | $1,379 | $161,185 | $0 | $0 |
| 2021 | $134 | $239,280 | $60,000 | $179,280 |
| 2020 | $1,257 | $209,400 | $60,000 | $149,400 |
| 2019 | $1,049 | $166,587 | $45,000 | $121,587 |
| 2018 | $964 | $148,040 | $45,000 | $103,040 |
| 2017 | $898 | $75,350 | $0 | $0 |
| 2016 | $914 | $75,350 | $0 | $0 |
| 2015 | $918 | $75,350 | $0 | $0 |
| 2014 | $875 | $73,225 | $0 | $0 |
| 2013 | -- | $73,225 | $0 | $0 |
Source: Public Records
Map
Nearby Homes
Your Personal Tour Guide
Ask me questions while you tour the home.