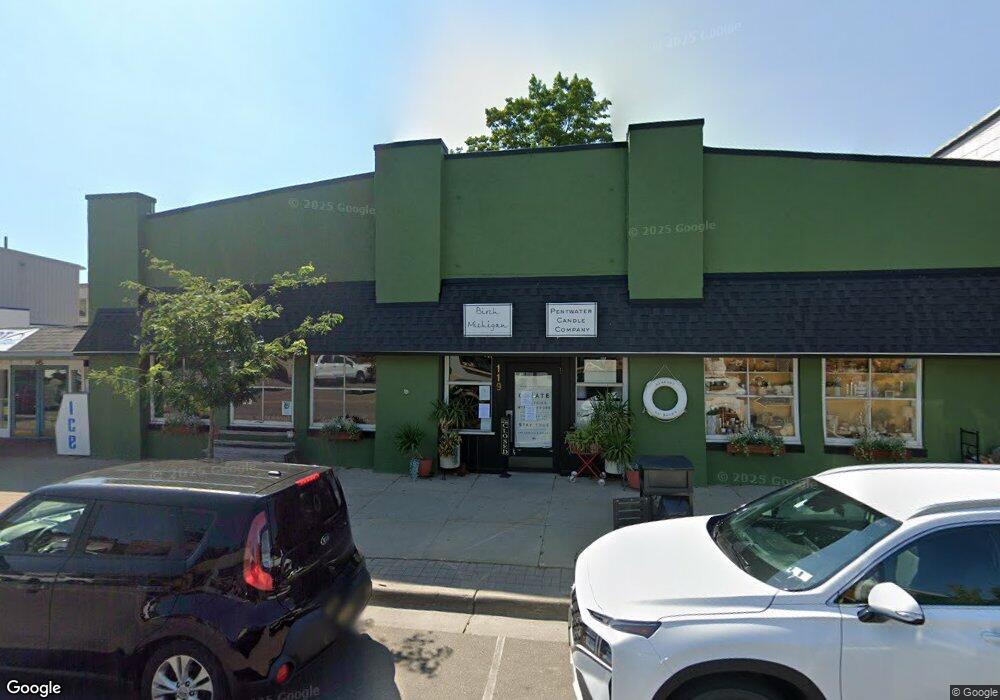
119 S Hancock St Pentwater, MI 49449
Estimated Value: $362,591
--
Bed
--
Bath
3,840
Sq Ft
$94/Sq Ft
Est. Value
About This Home
This home is located at 119 S Hancock St, Pentwater, MI 49449 and is currently estimated at $362,591, approximately $94 per square foot. 119 S Hancock St is a home located in Oceana County with nearby schools including Pentwater Public School.
Ownership History
Date
Name
Owned For
Owner Type
Purchase Details
Closed on
May 18, 2018
Sold by
Turnipseed Llc
Bought by
Building On Main Llc
Current Estimated Value
Home Financials for this Owner
Home Financials are based on the most recent Mortgage that was taken out on this home.
Original Mortgage
$176,000
Outstanding Balance
$151,542
Interest Rate
4.4%
Mortgage Type
Commercial
Estimated Equity
$211,049
Purchase Details
Closed on
Mar 15, 2012
Sold by
Decker & Burdick Properties
Bought by
Turnipseed Llc
Home Financials for this Owner
Home Financials are based on the most recent Mortgage that was taken out on this home.
Original Mortgage
$165,000
Interest Rate
3.86%
Mortgage Type
Future Advance Clause Open End Mortgage
Purchase Details
Closed on
Jan 1, 1996
Sold by
Emery and D
Bought by
Emery and D
Create a Home Valuation Report for This Property
The Home Valuation Report is an in-depth analysis detailing your home's value as well as a comparison with similar homes in the area
Home Values in the Area
Average Home Value in this Area
Purchase History
| Date | Buyer | Sale Price | Title Company |
|---|---|---|---|
| Building On Main Llc | -- | Oceana Land Title Agency Inc | |
| Turnipseed Llc | -- | None Available | |
| Emery | $140,000 | -- |
Source: Public Records
Mortgage History
| Date | Status | Borrower | Loan Amount |
|---|---|---|---|
| Open | Building On Main Llc | $176,000 | |
| Previous Owner | Turnipseed Llc | $165,000 |
Source: Public Records
Tax History Compared to Growth
Tax History
| Year | Tax Paid | Tax Assessment Tax Assessment Total Assessment is a certain percentage of the fair market value that is determined by local assessors to be the total taxable value of land and additions on the property. | Land | Improvement |
|---|---|---|---|---|
| 2025 | $5,086 | $164,000 | $80,300 | $83,700 |
| 2024 | $2,992 | $149,500 | $77,600 | $71,900 |
| 2023 | $4,613 | $134,700 | $69,700 | $65,000 |
| 2022 | $6,058 | $115,100 | $0 | $0 |
| 2021 | $5,896 | $109,900 | $45,200 | $64,700 |
| 2020 | $5,859 | $108,500 | $45,200 | $63,300 |
| 2019 | $5,735 | $56,300 | $56,300 | $0 |
| 2018 | $6,214 | $103,200 | $0 | $0 |
| 2017 | $6,214 | $114,200 | $0 | $0 |
| 2016 | -- | $127,200 | $0 | $0 |
| 2013 | -- | $140,300 | $0 | $0 |
Source: Public Records
Map
Nearby Homes
- 41 N Dover St
- 517 S Wythe St
- 0000 Park St
- 340 E Hanover St
- 1112 2nd St
- 90 S Clymer St
- 559 Sands St
- vl 3rd Ave
- 0 Sands St - Lot A
- 0 Sands Street - Vacant
- 0 Morris St - Lot B Unit 25010940
- 935 6th St
- 921 N Hancock St
- 1209 6th St
- 5921 W Longbridge Rd
- 0 N 56th Ave Unit Parcel A 25010626
- LOT 38 Longbridge Rd
- 0 Longbridge Rd
- 5293 W Monroe Rd
- 8641 N Perry Ave
- 145 S Hancock St
- 111 S Hancock St
- 41 1st St
- 167 S Hancock St
- 112 S Hancock St
- 134 S Hancock St
- 59 1st St
- 50 2nd St
- 168 S Hancock St
- 80 S Rutledge St
- 80 S Rutledge St
- 42 W 2nd St Unit 3
- 42 W 2nd St Unit 9
- 42 2nd St Unit 10
- 42 2nd St Unit 9
- 42 2nd St Unit 12
- 42 2nd St
- 42 2nd St Unit 3
- 180 S Hancock St
- 61 1st St