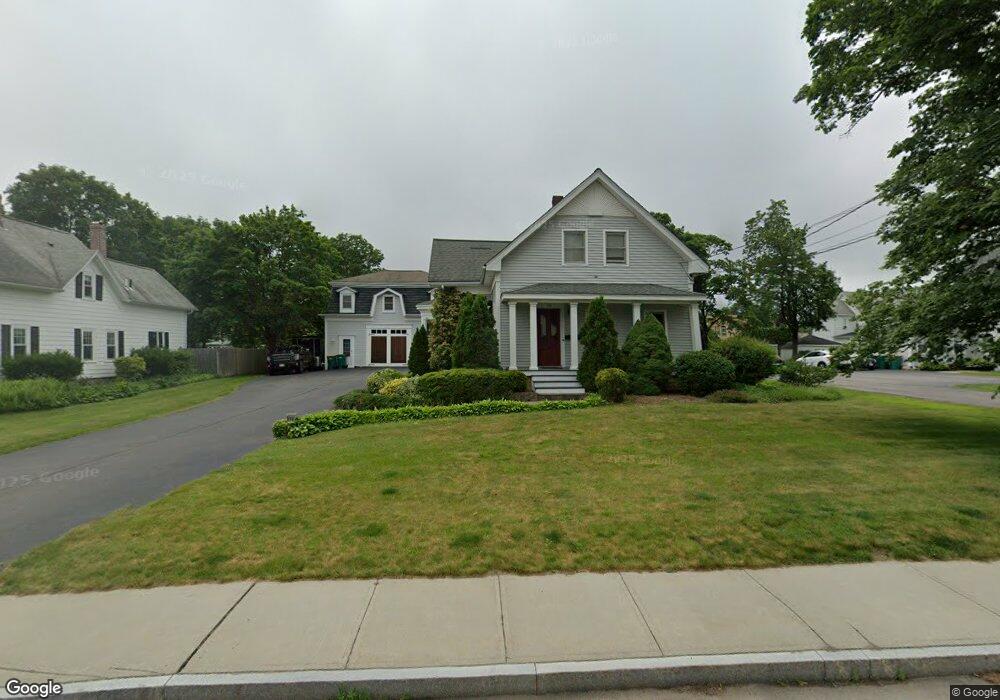
119 S Main St Mansfield, MA 02048
Estimated Value: $704,000 - $1,010,000
5
Beds
2
Baths
3,491
Sq Ft
$237/Sq Ft
Est. Value
About This Home
This home is located at 119 S Main St, Mansfield, MA 02048 and is currently estimated at $826,555, approximately $236 per square foot. 119 S Main St is a home located in Bristol County with nearby schools including Everett W. Robinson Elementary School, Jordan/Jackson Elementary School, and Harold L. Qualters Middle School.
Ownership History
Date
Name
Owned For
Owner Type
Purchase Details
Closed on
Sep 21, 1990
Sold by
Durmis Julius J
Bought by
Cushing James S
Current Estimated Value
Home Financials for this Owner
Home Financials are based on the most recent Mortgage that was taken out on this home.
Original Mortgage
$139,400
Interest Rate
9.89%
Mortgage Type
Purchase Money Mortgage
Create a Home Valuation Report for This Property
The Home Valuation Report is an in-depth analysis detailing your home's value as well as a comparison with similar homes in the area
Home Values in the Area
Average Home Value in this Area
Purchase History
| Date | Buyer | Sale Price | Title Company |
|---|---|---|---|
| Cushing James S | $154,900 | -- |
Source: Public Records
Mortgage History
| Date | Status | Borrower | Loan Amount |
|---|---|---|---|
| Open | Cushing James S | $139,000 | |
| Closed | Cushing James S | $145,000 | |
| Closed | Cushing James S | $142,400 | |
| Closed | Cushing James S | $139,400 |
Source: Public Records
Tax History
| Year | Tax Paid | Tax Assessment Tax Assessment Total Assessment is a certain percentage of the fair market value that is determined by local assessors to be the total taxable value of land and additions on the property. | Land | Improvement |
|---|---|---|---|---|
| 2025 | $10,884 | $826,400 | $236,400 | $590,000 |
| 2024 | $10,356 | $767,100 | $236,400 | $530,700 |
| 2023 | $9,838 | $698,200 | $236,400 | $461,800 |
| 2022 | $10,006 | $659,600 | $218,800 | $440,800 |
| 2021 | $8,892 | $578,900 | $191,600 | $387,300 |
| 2020 | $8,751 | $569,700 | $182,400 | $387,300 |
| 2019 | $7,739 | $508,500 | $151,900 | $356,600 |
| 2018 | $7,569 | $486,100 | $144,900 | $341,200 |
| 2017 | $6,317 | $420,600 | $140,700 | $279,900 |
| 2016 | $5,666 | $367,700 | $133,900 | $233,800 |
| 2015 | $5,224 | $337,000 | $133,900 | $203,100 |
Source: Public Records
Map
Nearby Homes
- 2 N Main St Unit B201
- 97 East St
- 28 Court St
- 46 Hope St
- 107 Church St
- 122 Samoset Ave
- 22 Pleasant St Unit B
- 7 Fieldstone Dr
- 1 Deer Path Ln
- 166 Chauncy St
- 25 Kingman Ave
- 28 Angell St
- 14 Windchime Dr
- 7 Liberty St
- 619 N Main St
- 631 East St Unit L101
- 356 Central St
- 16 County St
- 1769 West St
- 19 Barberry Rd
Your Personal Tour Guide
Ask me questions while you tour the home.