Estimated Value: $75,000 - $103,000
3
Beds
1
Bath
960
Sq Ft
$90/Sq Ft
Est. Value
About This Home
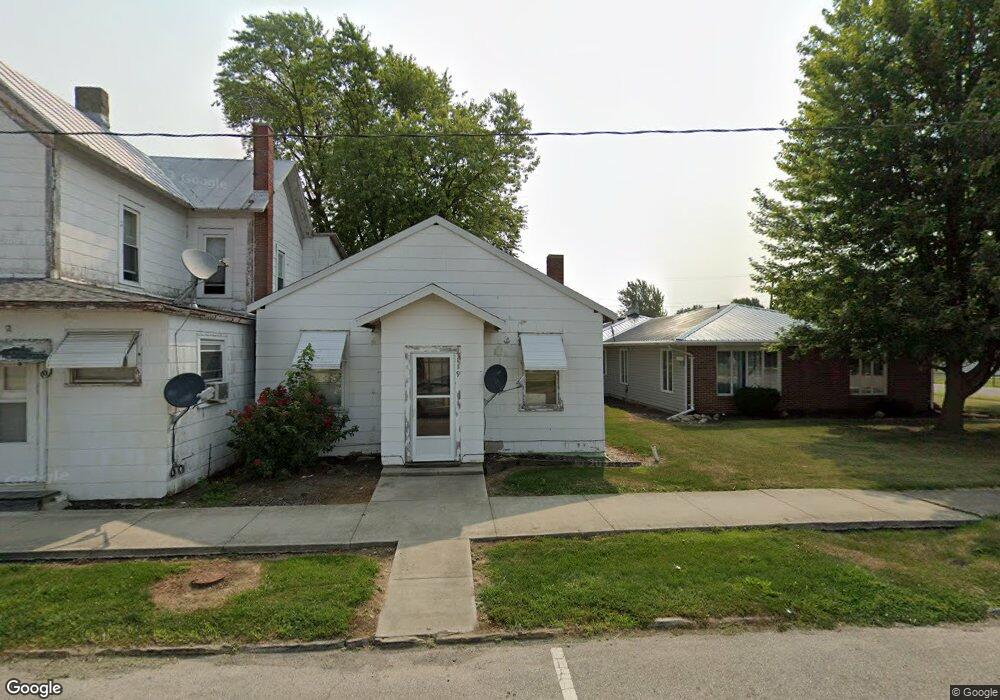
This home is located at 119 S Main St, Payne, OH 45880 and is currently estimated at $86,592, approximately $90 per square foot. 119 S Main St is a home with nearby schools including Wayne Trace High School and Divine Mercy School.
Ownership History
Date
Name
Owned For
Owner Type
Purchase Details
Closed on
Dec 13, 2019
Sold by
Develvis William A and Crawford Connie S
Bought by
Devford Properties Llc
Current Estimated Value
Purchase Details
Closed on
Mar 8, 2017
Sold by
Wobler John and Wobler John J
Bought by
Develvis William and Crawford Connie
Home Financials for this Owner
Home Financials are based on the most recent Mortgage that was taken out on this home.
Original Mortgage
$51,400
Interest Rate
4.19%
Mortgage Type
Purchase Money Mortgage
Purchase Details
Closed on
Feb 11, 2013
Sold by
Riley Carl L and Riley Marietta R
Bought by
Wobler John
Home Financials for this Owner
Home Financials are based on the most recent Mortgage that was taken out on this home.
Original Mortgage
$33,600
Interest Rate
4%
Mortgage Type
Purchase Money Mortgage
Purchase Details
Closed on
Oct 12, 1988
Bought by
Wobler John
Create a Home Valuation Report for This Property
The Home Valuation Report is an in-depth analysis detailing your home's value as well as a comparison with similar homes in the area
Home Values in the Area
Average Home Value in this Area
Purchase History
| Date | Buyer | Sale Price | Title Company |
|---|---|---|---|
| Devford Properties Llc | -- | None Available | |
| Develvis William | $49,900 | None Available | |
| Wobler John | $39,500 | None Available | |
| Wobler John | $13,000 | -- |
Source: Public Records
Mortgage History
| Date | Status | Borrower | Loan Amount |
|---|---|---|---|
| Previous Owner | Develvis William | $51,400 | |
| Previous Owner | Wobler John | $33,600 |
Source: Public Records
Tax History Compared to Growth
Tax History
| Year | Tax Paid | Tax Assessment Tax Assessment Total Assessment is a certain percentage of the fair market value that is determined by local assessors to be the total taxable value of land and additions on the property. | Land | Improvement |
|---|---|---|---|---|
| 2024 | $424 | $10,370 | $1,930 | $8,440 |
| 2023 | $424 | $10,370 | $1,930 | $8,440 |
| 2022 | $412 | $10,370 | $1,930 | $8,440 |
| 2021 | $361 | $7,880 | $1,820 | $6,060 |
| 2020 | $374 | $7,880 | $1,820 | $6,060 |
| 2019 | $376 | $7,320 | $1,820 | $5,500 |
| 2018 | $331 | $7,320 | $1,820 | $5,500 |
| 2017 | $329 | $7,320 | $1,820 | $5,500 |
| 2016 | $326 | $7,320 | $1,820 | $5,500 |
| 2015 | $342 | $7,810 | $2,730 | $5,080 |
| 2014 | $346 | $7,810 | $2,730 | $5,080 |
| 2013 | $398 | $8,370 | $2,730 | $5,640 |
Source: Public Records
Map
Nearby Homes
- 412 S Laura St
- 600 W Merrin St
- 100 Proxmire St
- 813 Brian Dr
- 6312 Meadowlark Ln
- 5368 Road 124
- 25920 Railroad St
- 25812 Maumee Center Rd
- 607 Erie St
- 4616 Homestead Trail
- 2386 Road 250
- 4783 Legacy Cove
- 13149 Road 27b
- 208 W River St
- 4602 Indiana 101
- 22608 Main St
- 5660 Road 180
- 309 N Madison St
- 22238 Travertine Run
- 22215 Travertine Run