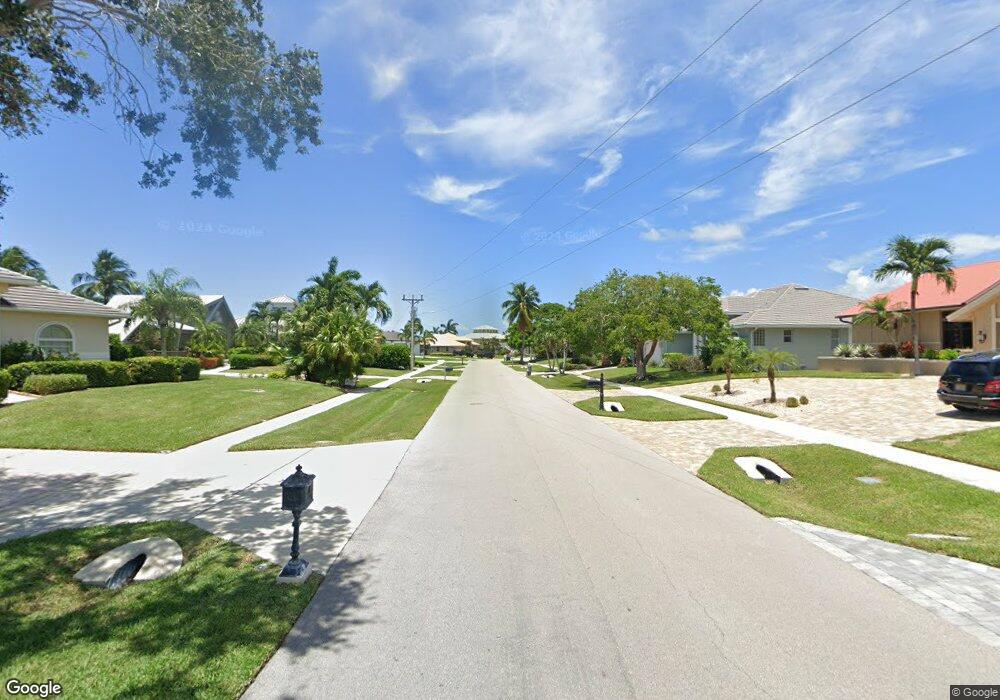
119 S South Seas Ct Marco Island, FL 34145
Estimated Value: $1,332,000 - $1,633,000
3
Beds
3
Baths
2,123
Sq Ft
$708/Sq Ft
Est. Value
About This Home
This home is located at 119 S South Seas Ct, Marco Island, FL 34145 and is currently estimated at $1,502,224, approximately $707 per square foot. 119 S South Seas Ct is a home located in Collier County with nearby schools including Tommie Barfield Elementary School, Manatee Middle School, and Lely High School.
Ownership History
Date
Name
Owned For
Owner Type
Purchase Details
Closed on
Feb 7, 2020
Sold by
Duran Rosendo J
Bought by
Kafka Marc C and Kafka Mary K
Current Estimated Value
Home Financials for this Owner
Home Financials are based on the most recent Mortgage that was taken out on this home.
Original Mortgage
$608,000
Interest Rate
3.2%
Mortgage Type
New Conventional
Create a Home Valuation Report for This Property
The Home Valuation Report is an in-depth analysis detailing your home's value as well as a comparison with similar homes in the area
Home Values in the Area
Average Home Value in this Area
Purchase History
| Date | Buyer | Sale Price | Title Company |
|---|---|---|---|
| Kafka Marc C | $760,000 | Attorney |
Source: Public Records
Mortgage History
| Date | Status | Borrower | Loan Amount |
|---|---|---|---|
| Previous Owner | Kafka Marc C | $608,000 |
Source: Public Records
Tax History Compared to Growth
Tax History
| Year | Tax Paid | Tax Assessment Tax Assessment Total Assessment is a certain percentage of the fair market value that is determined by local assessors to be the total taxable value of land and additions on the property. | Land | Improvement |
|---|---|---|---|---|
| 2025 | $11,275 | $1,147,390 | -- | -- |
| 2024 | $12,493 | $1,043,082 | -- | -- |
| 2023 | $12,493 | $951,273 | $0 | $0 |
| 2022 | $11,203 | $864,794 | $0 | $0 |
| 2021 | $8,733 | $786,176 | $413,602 | $372,574 |
| 2020 | $7,929 | $678,737 | $0 | $0 |
| 2019 | $8,139 | $617,034 | $273,504 | $343,530 |
| 2018 | $8,468 | $645,752 | $313,280 | $332,472 |
| 2017 | $8,872 | $674,480 | $309,760 | $364,720 |
| 2016 | $8,665 | $620,555 | $0 | $0 |
| 2015 | $7,887 | $564,141 | $0 | $0 |
| 2014 | $7,450 | $514,809 | $0 | $0 |
Source: Public Records
Map
Nearby Homes