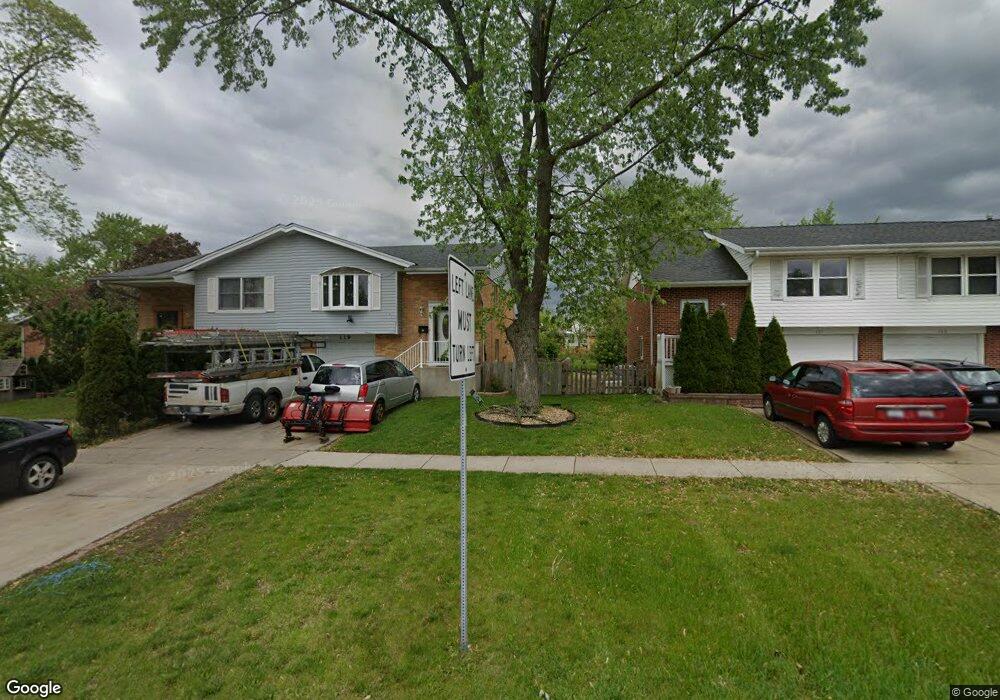
119 S Springinsguth Rd Unit 9 Schaumburg, IL 60193
South Schaumburg NeighborhoodEstimated Value: $275,000 - $307,000
3
Beds
2
Baths
1,480
Sq Ft
$196/Sq Ft
Est. Value
About This Home
This home is located at 119 S Springinsguth Rd Unit 9, Schaumburg, IL 60193 and is currently estimated at $290,769, approximately $196 per square foot. 119 S Springinsguth Rd Unit 9 is a home located in Cook County with nearby schools including Campanelli Elementary School, Jane Addams Junior High School, and Schaumburg High School.
Ownership History
Date
Name
Owned For
Owner Type
Purchase Details
Closed on
Jun 4, 2024
Sold by
Hasan Aminaben M and Hasan Mahammadbhai R
Bought by
Hasan Nihar and Hasan Nishat
Current Estimated Value
Purchase Details
Closed on
Dec 23, 2014
Sold by
Hasan Aminaben M and Hasan Mammadbhai R
Bought by
Hasan Aminaben M and Hasan Mahammadbhai R
Home Financials for this Owner
Home Financials are based on the most recent Mortgage that was taken out on this home.
Original Mortgage
$92,000
Interest Rate
4%
Mortgage Type
New Conventional
Purchase Details
Closed on
Feb 28, 2011
Sold by
Hussain Syed R and Hussain Tasneem
Bought by
Hasan Aminaben M and Hasan Mahammadbhai R
Home Financials for this Owner
Home Financials are based on the most recent Mortgage that was taken out on this home.
Original Mortgage
$100,000
Interest Rate
5.09%
Mortgage Type
New Conventional
Create a Home Valuation Report for This Property
The Home Valuation Report is an in-depth analysis detailing your home's value as well as a comparison with similar homes in the area
Home Values in the Area
Average Home Value in this Area
Purchase History
| Date | Buyer | Sale Price | Title Company |
|---|---|---|---|
| Hasan Nihar | -- | None Listed On Document | |
| Hasan Aminaben M | -- | Fidelity National Title | |
| Hasan Aminaben M | $125,000 | Fatic |
Source: Public Records
Mortgage History
| Date | Status | Borrower | Loan Amount |
|---|---|---|---|
| Previous Owner | Hasan Aminaben M | $92,000 | |
| Previous Owner | Hasan Aminaben M | $100,000 |
Source: Public Records
Tax History Compared to Growth
Tax History
| Year | Tax Paid | Tax Assessment Tax Assessment Total Assessment is a certain percentage of the fair market value that is determined by local assessors to be the total taxable value of land and additions on the property. | Land | Improvement |
|---|---|---|---|---|
| 2024 | $3,931 | $20,000 | $3,500 | $16,500 |
| 2023 | $3,761 | $20,000 | $3,500 | $16,500 |
| 2022 | $3,761 | $20,000 | $3,500 | $16,500 |
| 2021 | $2,551 | $14,410 | $2,157 | $12,253 |
| 2020 | $2,629 | $14,410 | $2,157 | $12,253 |
| 2019 | $2,686 | $16,192 | $2,157 | $14,035 |
| 2018 | $3,264 | $17,059 | $1,930 | $15,129 |
| 2017 | $4,042 | $17,059 | $1,930 | $15,129 |
| 2016 | $4,022 | $17,059 | $1,930 | $15,129 |
| 2015 | $3,663 | $14,866 | $1,703 | $13,163 |
| 2014 | $3,639 | $14,866 | $1,703 | $13,163 |
| 2013 | $4,286 | $14,866 | $1,703 | $13,163 |
Source: Public Records
Map
Nearby Homes
- 231 Webster Ln
- 1336 Wakeby Ln Unit 444
- 100 Waban Ct
- 13 Eastham Ct Unit 842
- 108 Idlestone Ln
- 1614 Kingston Ln
- 1601 Kingston Ln
- 1939 Weston Ln
- 521 Auburn Ln
- 227 S Walnut Ln
- 1933 Whittier Ln
- 1125 Charlene Ln
- 104 N Braintree Dr
- 702 Auburn Cir
- 630 Clover Ln
- 1403 Hampton Ln
- 8181 Northway Dr
- 1908 Capri Ln
- 8177 Northway Dr
- 1123 Stoughton Ct Unit 1664
- 121 S Springinsguth Rd
- 117 S Springinsguth Rd
- 123 S Springinsguth Rd
- 1544 Revere Cir
- 125 S Springinsguth Rd
- 1542 Revere Cir
- 111 S Springinsguth Rd
- 1545 Revere Cir
- 127 S Springinsguth Rd
- 1536 Revere Cir
- 1543 Revere Cir
- 1548 Revere Cir
- 1534 Revere Cir
- 109 S Springinsguth Rd
- 1537 Revere Cir
- 1546 Revere Cir
- 1540 Revere Cir
- 1535 Revere Cir
- 118 S Springinsguth Rd
- 1528 Revere Cir