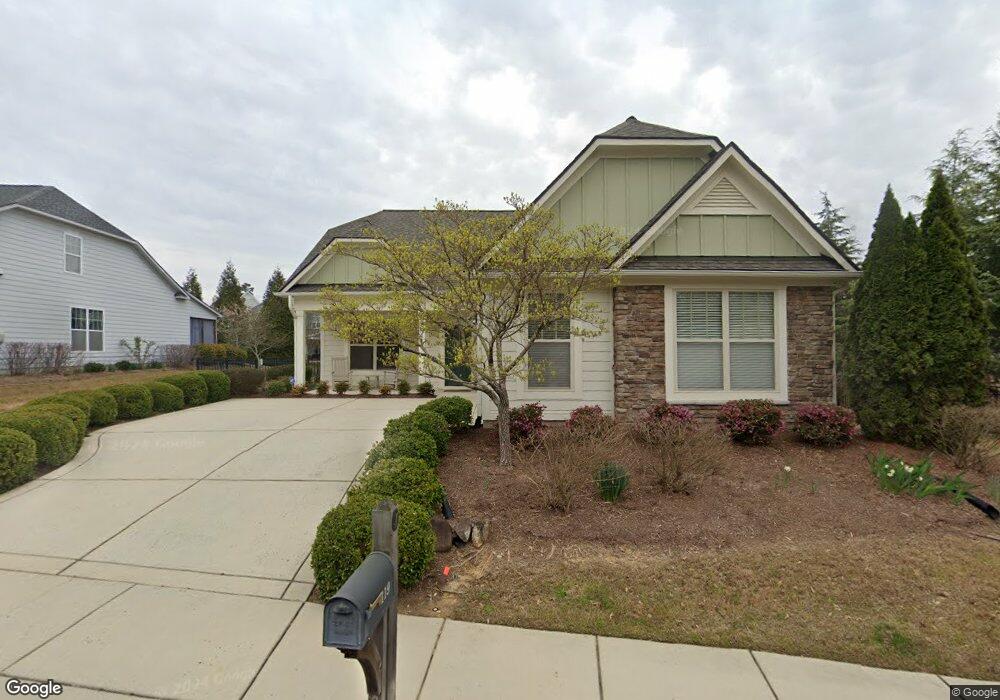
119 Serenity Hill Cir Chapel Hill, NC 27516
Estimated Value: $573,000 - $683,000
3
Beds
3
Baths
1,982
Sq Ft
$309/Sq Ft
Est. Value
About This Home
This home is located at 119 Serenity Hill Cir, Chapel Hill, NC 27516 and is currently estimated at $611,658, approximately $308 per square foot. 119 Serenity Hill Cir is a home located in Chatham County with nearby schools including Margaret B. Pollard Middle School and Woods Charter.
Ownership History
Date
Name
Owned For
Owner Type
Purchase Details
Closed on
Sep 10, 2018
Sold by
Davis Karen A
Bought by
Cheshire Gail
Current Estimated Value
Home Financials for this Owner
Home Financials are based on the most recent Mortgage that was taken out on this home.
Original Mortgage
$100,000
Outstanding Balance
$61,578
Interest Rate
4.5%
Mortgage Type
New Conventional
Estimated Equity
$550,080
Purchase Details
Closed on
Aug 9, 2013
Sold by
Dunham Laura G and Dunham Edgar A
Bought by
Davis Karen A
Purchase Details
Closed on
Feb 28, 2012
Sold by
M/I Homes Of Raleigh Llc
Bought by
Dunham Laura G and Dunham Edgar A
Home Financials for this Owner
Home Financials are based on the most recent Mortgage that was taken out on this home.
Original Mortgage
$100,000
Interest Rate
3.9%
Mortgage Type
New Conventional
Purchase Details
Closed on
Jan 26, 2011
Sold by
Nnp Briar Chapel Llc
Bought by
M/I Homes Of Raleigh Llc
Create a Home Valuation Report for This Property
The Home Valuation Report is an in-depth analysis detailing your home's value as well as a comparison with similar homes in the area
Home Values in the Area
Average Home Value in this Area
Purchase History
| Date | Buyer | Sale Price | Title Company |
|---|---|---|---|
| Cheshire Gail | $355,000 | None Available | |
| Davis Karen A | $295,000 | None Available | |
| Dunham Laura G | $258,500 | None Available | |
| M/I Homes Of Raleigh Llc | $54,000 | None Available |
Source: Public Records
Mortgage History
| Date | Status | Borrower | Loan Amount |
|---|---|---|---|
| Open | Cheshire Gail | $100,000 | |
| Previous Owner | Dunham Laura G | $100,000 |
Source: Public Records
Tax History Compared to Growth
Tax History
| Year | Tax Paid | Tax Assessment Tax Assessment Total Assessment is a certain percentage of the fair market value that is determined by local assessors to be the total taxable value of land and additions on the property. | Land | Improvement |
|---|---|---|---|---|
| 2024 | $3,405 | $399,148 | $131,250 | $267,898 |
| 2023 | $3,245 | $399,148 | $131,250 | $267,898 |
| 2022 | $3,125 | $399,148 | $131,250 | $267,898 |
| 2021 | $2,428 | $399,148 | $131,250 | $267,898 |
| 2020 | $2,428 | $319,559 | $60,000 | $259,559 |
| 2019 | $2,709 | $319,559 | $60,000 | $259,559 |
| 2018 | $0 | $332,083 | $60,000 | $272,083 |
| 2017 | $2,553 | $332,083 | $60,000 | $272,083 |
| 2016 | $2,215 | $288,226 | $60,000 | $228,226 |
| 2015 | $2,180 | $288,226 | $60,000 | $228,226 |
| 2014 | -- | $288,226 | $60,000 | $228,226 |
| 2013 | -- | $288,226 | $60,000 | $228,226 |
Source: Public Records
Map
Nearby Homes
- 136 Serenity Hill Cir
- 253 Tobacco Farm Way
- 265 Tobacco Farm Way
- 79 Heatherwood Dr
- 322 Tobacco Farm Way
- 32 Treywood Ln
- 36 Summersweet Ln
- 347 Dark Forest Dr
- 51 Cliffdale Rd
- 1168 Great Ridge Pkwy
- 42 Juneberry Dr
- 165 Old Piedmont Cir
- 40 Mallard Landing Dr
- 1420 Briar Chapel Pkwy
- 49 Salt Cedar Ln
- 610 Bennett Mountain Trace
- 1980 Great Ridge Pkwy
- 442 Granite Mill Blvd
- 438 Granite Mill Blvd
- 554 Beacon Ridge Blvd
- 107 Serenity Hill Cir
- 39 Kimbolton Place
- 364 Hill Creek Blvd
- 374 Hill Creek Blvd
- 89 Serenity Hill Cir
- 348 Hill Creek Blvd
- 116 Serenity Hill Cir
- 45 Kimbolton Place
- 124 Serenity Hill Cir
- 102 Serenity Hill Cir
- 81 Serenity Hill Cir
- 84 Serenity Hill Cir
- 57 Kimbolton Place
- 235 Serenity Hill Cir
- 146 Serenity Hill Cir
- 73 N Serenity Hill Cir
- 310 Hill Creek Blvd
- 44 Kimbolton Place
- 72 Serenity Hill Cir
- 371 Hill Creek Blvd