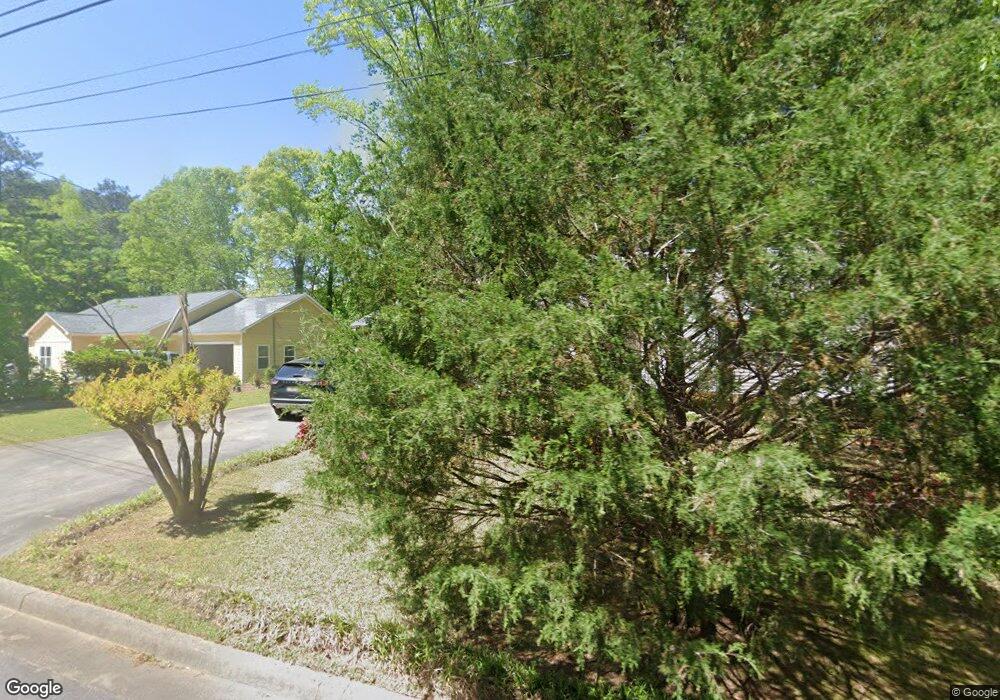
119 Shannon Chase Dr Unit 1 Fairburn, GA 30213
Estimated Value: $243,000 - $272,000
3
Beds
2
Baths
1,998
Sq Ft
$127/Sq Ft
Est. Value
About This Home
This home is located at 119 Shannon Chase Dr Unit 1, Fairburn, GA 30213 and is currently estimated at $254,068, approximately $127 per square foot. 119 Shannon Chase Dr Unit 1 is a home located in Fulton County with nearby schools including Campbell Elementary School, Renaissance Middle School, and Creekside High School.
Ownership History
Date
Name
Owned For
Owner Type
Purchase Details
Closed on
Feb 23, 2006
Sold by
Hawkins Carol B
Bought by
Mccarden Brenda S
Current Estimated Value
Home Financials for this Owner
Home Financials are based on the most recent Mortgage that was taken out on this home.
Original Mortgage
$128,850
Outstanding Balance
$71,848
Interest Rate
6.04%
Mortgage Type
New Conventional
Estimated Equity
$182,220
Purchase Details
Closed on
Feb 15, 1999
Sold by
Rivera Edwin and Rivera Damaris J
Bought by
Beasley Hope B
Home Financials for this Owner
Home Financials are based on the most recent Mortgage that was taken out on this home.
Original Mortgage
$87,200
Interest Rate
6.79%
Mortgage Type
New Conventional
Purchase Details
Closed on
Oct 31, 1994
Sold by
Bass Stanley R Margaret
Bought by
Peavy Janice
Home Financials for this Owner
Home Financials are based on the most recent Mortgage that was taken out on this home.
Original Mortgage
$77,403
Interest Rate
8.92%
Mortgage Type
FHA
Create a Home Valuation Report for This Property
The Home Valuation Report is an in-depth analysis detailing your home's value as well as a comparison with similar homes in the area
Home Values in the Area
Average Home Value in this Area
Purchase History
| Date | Buyer | Sale Price | Title Company |
|---|---|---|---|
| Mccarden Brenda S | $129,900 | -- | |
| Beasley Hope B | $97,000 | -- | |
| Peavy Janice | $77,000 | -- |
Source: Public Records
Mortgage History
| Date | Status | Borrower | Loan Amount |
|---|---|---|---|
| Open | Mccarden Brenda S | $128,850 | |
| Previous Owner | Beasley Hope B | $87,200 | |
| Previous Owner | Peavy Janice | $77,403 |
Source: Public Records
Tax History Compared to Growth
Tax History
| Year | Tax Paid | Tax Assessment Tax Assessment Total Assessment is a certain percentage of the fair market value that is determined by local assessors to be the total taxable value of land and additions on the property. | Land | Improvement |
|---|---|---|---|---|
| 2025 | $548 | $85,800 | $23,680 | $62,120 |
| 2023 | $1,618 | $57,320 | $10,560 | $46,760 |
| 2022 | $606 | $57,320 | $10,560 | $46,760 |
| 2021 | $356 | $30,240 | $5,320 | $24,920 |
| 2020 | $354 | $28,040 | $5,240 | $22,800 |
| 2019 | $263 | $27,560 | $5,160 | $22,400 |
| 2018 | $450 | $26,920 | $5,040 | $21,880 |
| 2017 | $344 | $20,280 | $4,840 | $15,440 |
| 2016 | $343 | $20,280 | $4,840 | $15,440 |
| 2015 | $344 | $20,280 | $4,840 | $15,440 |
| 2014 | $346 | $20,280 | $4,840 | $15,440 |
Source: Public Records
Map
Nearby Homes
- 104 Shannon Chase Way Unit 2
- 930 Parkway Rd
- 296 Orme St
- 191 Pine St NE
- 118 Greenwood St
- 111 Poplar St
- 179 Stanchion Dr
- 187 Stanchion Dr
- 88 Greenwood St
- 185 Stanchion Dr
- 422 Camrose Ave
- 424 Camrose Ave
- 423 Camrose Ave
- 203 Switcher Ct
- 323 Crimson Dr Unit 124
- 323 Crimson Dr
- 183 Stanchion Dr
- 291 Switcher Ct
- 117 Shannon Chase Dr
- 100 Shannon Chase Way Unit 2
- 124 Shannon Chase Dr
- 122 Shannon Chase Dr
- 120 Shannon Chase Dr Unit 1
- 118 Shannon Chase Dr
- 260 Aprils Way Unit ONE THIR
- 260 Aprils Way
- 115 Shannon Chase Dr
- 850 Parkway Rd
- 860 Parkway Rd
- 860 Parkway Rd Unit 860
- 830 Parkway Rd
- 870 Parkway Rd
- 840 Parkway Rd
- 820 Parkway Rd
- 810 Parkway Rd
- 116 Shannon Chase Dr Unit 1
- 800 Parkway Rd Unit E
- 800 Parkway Rd