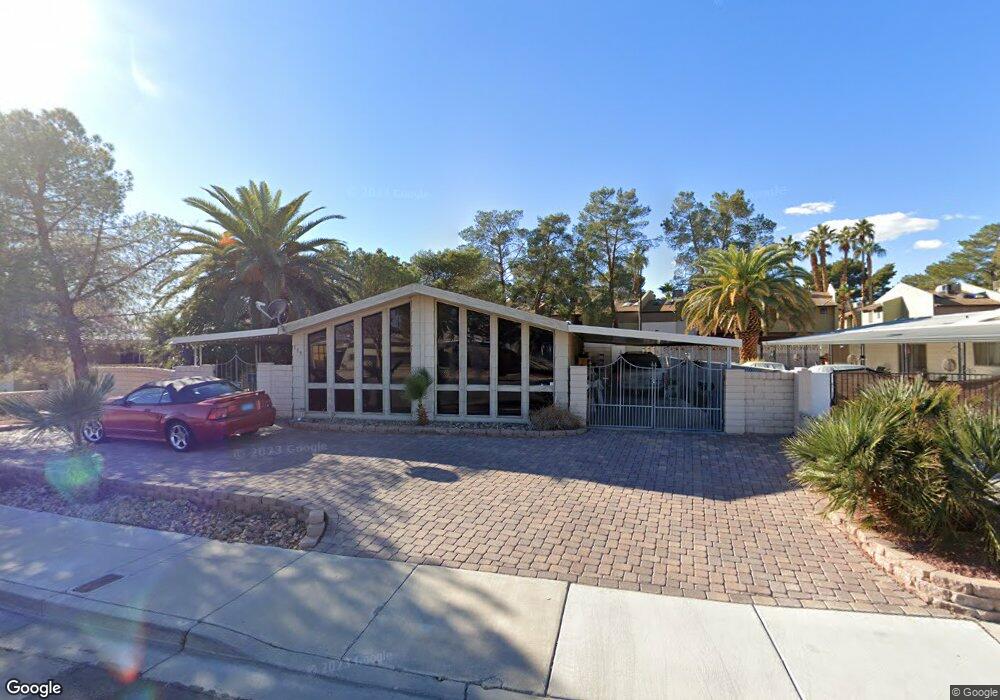
119 Sir George Dr Las Vegas, NV 89110
Estimated Value: $237,000 - $280,134
3
Beds
2
Baths
1,526
Sq Ft
$171/Sq Ft
Est. Value
About This Home
This home is located at 119 Sir George Dr, Las Vegas, NV 89110 and is currently estimated at $260,784, approximately $170 per square foot. 119 Sir George Dr is a home located in Clark County with nearby schools including Charlotte & Jerry Keller Elementary School, Richard J. Rundle Elementary School, and Duane D. Keller Middle School.
Ownership History
Date
Name
Owned For
Owner Type
Purchase Details
Closed on
Nov 18, 2009
Sold by
Walen Phyllis Jean
Bought by
Walen Phyllis Jean and The Phyllis Jean Walen Living Trust
Current Estimated Value
Purchase Details
Closed on
Oct 8, 2009
Sold by
Walen H Graydon
Bought by
Walen Phyllis Jean
Purchase Details
Closed on
Jul 13, 2006
Sold by
Simmons Nadine J
Bought by
Walen H Graydon
Purchase Details
Closed on
Aug 30, 1999
Sold by
Causey Susan D
Bought by
Culver Harry L and Culver Betty L
Purchase Details
Closed on
May 30, 1997
Sold by
Culver Harry L and Culver Betty L
Bought by
Causey Susan D
Home Financials for this Owner
Home Financials are based on the most recent Mortgage that was taken out on this home.
Original Mortgage
$56,700
Interest Rate
11.5%
Create a Home Valuation Report for This Property
The Home Valuation Report is an in-depth analysis detailing your home's value as well as a comparison with similar homes in the area
Home Values in the Area
Average Home Value in this Area
Purchase History
| Date | Buyer | Sale Price | Title Company |
|---|---|---|---|
| Walen Phyllis Jean | -- | None Available | |
| Walen Phyllis Jean | -- | None Available | |
| Walen H Graydon | $120,000 | None Available | |
| Culver Harry L | $25,514 | Stewart Title | |
| Causey Susan D | $81,000 | Ati Title |
Source: Public Records
Mortgage History
| Date | Status | Borrower | Loan Amount |
|---|---|---|---|
| Previous Owner | Causey Susan D | $56,700 | |
| Closed | Causey Susan D | $20,250 |
Source: Public Records
Tax History Compared to Growth
Tax History
| Year | Tax Paid | Tax Assessment Tax Assessment Total Assessment is a certain percentage of the fair market value that is determined by local assessors to be the total taxable value of land and additions on the property. | Land | Improvement |
|---|---|---|---|---|
| 2025 | $523 | $39,071 | $22,400 | $16,671 |
| 2024 | $485 | $39,071 | $22,400 | $16,671 |
| 2023 | $485 | $34,376 | $18,550 | $15,826 |
| 2022 | $449 | $29,600 | $14,700 | $14,900 |
| 2021 | $416 | $28,232 | $13,650 | $14,582 |
| 2020 | $383 | $27,095 | $12,250 | $14,845 |
| 2019 | $359 | $24,911 | $9,800 | $15,111 |
| 2018 | $343 | $23,399 | $8,400 | $14,999 |
| 2017 | $569 | $18,969 | $6,650 | $12,319 |
| 2016 | $322 | $17,639 | $5,250 | $12,389 |
| 2015 | $320 | $18,006 | $4,900 | $13,106 |
| 2014 | $311 | $11,274 | $4,200 | $7,074 |
Source: Public Records
Map
Nearby Homes
- 130 Bel Port Dr Unit 133
- 136 Sir George Dr
- 153 Sir Thomas Dr
- 111 Sir Arthur Dr
- 140 Sir David Way
- 179 Sir George Dr
- 5330 E Charleston Blvd Unit 2
- 5330 E Charleston Blvd Unit 113
- 0 E Charleston Blvd
- 4928 Ronan Dr
- 280 Sir Phillip St
- 1200 Pleasant Brook St
- 1224 Pleasant Brook St
- 147 N Christy Ln
- 332 Sir Jeffery Cir
- 5353 Hollow Brook Ave
- 5564 Orchard Ln Unit 133
- 360 Sir Richard Dr E
- 1300 S Arlington St Unit 126
- 1300 S Arlington St Unit 120
- 121 Sir George Dr
- 123 Sir George Dr
- 144 Bel Port Dr
- 140 Bel Port Dr Unit 146
- 140 Bel Port Dr Unit 144
- 140 Bel Port Dr Unit 142
- 140 Bel Port Dr Unit 145
- 140 Bel Port Dr Unit 143
- 140 Bel Port Dr Unit 141
- 151 Bel Port Dr
- 150 Bel Port Dr Unit 155
- 150 Bel Port Dr Unit 153
- 150 Bel Port Dr Unit 151
- 150 Bel Port Dr Unit 156
- 150 Bel Port Dr Unit 154
- 150 Bel Port Dr Unit 152
- 114 Sir George Dr
- 153 Bel Port Dr
- 130 Bel Port Dr Unit 134
- 130 Bel Port Dr Unit 135