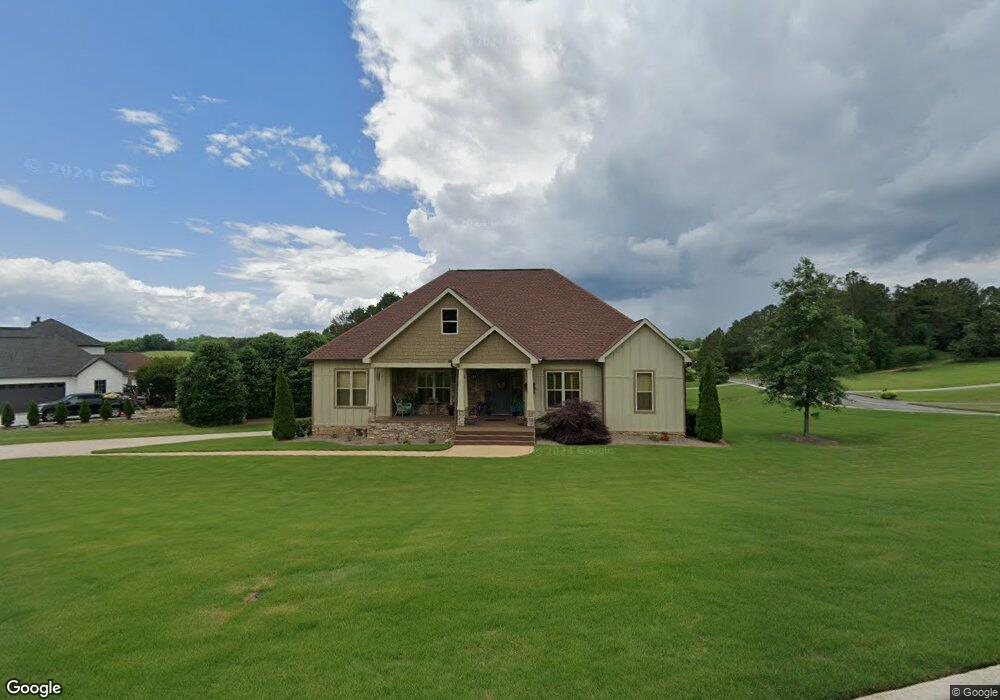
119 Southmont Dr NE Calhoun, GA 30701
Estimated Value: $481,227 - $594,000
3
Beds
3
Baths
2,894
Sq Ft
$183/Sq Ft
Est. Value
About This Home
This home is located at 119 Southmont Dr NE, Calhoun, GA 30701 and is currently estimated at $528,557, approximately $182 per square foot. 119 Southmont Dr NE is a home with nearby schools including Red Bud Elementary School, Red Bud Middle School, and Sonoraville High School.
Ownership History
Date
Name
Owned For
Owner Type
Purchase Details
Closed on
Jan 4, 2024
Sold by
Wilkins Crystal R
Bought by
Townsend Crystal R and Wilkins Crystal R
Current Estimated Value
Purchase Details
Closed on
Jun 4, 2019
Sold by
Wilkins Hugh N
Bought by
Wilkins Hugh N and Townsend Crystal R
Purchase Details
Closed on
Dec 20, 2017
Sold by
Corn Jerry D
Bought by
Wilkins Hugh
Purchase Details
Closed on
Feb 21, 2014
Sold by
Corn Jerry D
Bought by
Corn Jerry D and Corn Savannah
Purchase Details
Closed on
Feb 7, 2014
Sold by
Falls E Darlene
Bought by
Corn Jerry D
Purchase Details
Closed on
Dec 18, 2001
Sold by
Fields Ferry Development Co
Bought by
Falls Falls E and Falls David C
Create a Home Valuation Report for This Property
The Home Valuation Report is an in-depth analysis detailing your home's value as well as a comparison with similar homes in the area
Home Values in the Area
Average Home Value in this Area
Purchase History
| Date | Buyer | Sale Price | Title Company |
|---|---|---|---|
| Townsend Crystal R | -- | -- | |
| Wilkins Hugh N | -- | -- | |
| Wilkins Hugh | $22,500 | -- | |
| Corn Jerry D | -- | -- | |
| Corn Jerry D | $17,000 | -- | |
| Falls Falls E | -- | -- |
Source: Public Records
Tax History Compared to Growth
Tax History
| Year | Tax Paid | Tax Assessment Tax Assessment Total Assessment is a certain percentage of the fair market value that is determined by local assessors to be the total taxable value of land and additions on the property. | Land | Improvement |
|---|---|---|---|---|
| 2024 | $3,026 | $184,240 | $8,200 | $176,040 |
| 2023 | $2,714 | $171,960 | $8,200 | $163,760 |
| 2022 | $3,369 | $151,320 | $7,840 | $143,480 |
| 2021 | $2,781 | $126,360 | $7,840 | $118,520 |
| 2020 | $2,839 | $126,360 | $7,840 | $118,520 |
| 2019 | $3,640 | $126,360 | $7,840 | $118,520 |
| 2018 | $226 | $7,840 | $7,840 | $0 |
| 2017 | $232 | $7,840 | $7,840 | $0 |
| 2016 | $233 | $7,840 | $7,840 | $0 |
| 2015 | $235 | $7,840 | $7,840 | $0 |
| 2014 | $228 | $7,840 | $7,840 | $0 |
Source: Public Records
Map
Nearby Homes
- 0 Woodedge Dr NE Unit 7661757
- 0 Woodedge Dr NE Unit LOT 36
- 00 Hunts Gin Rd L1
- 426 Fields Ferry Dr NE
- 158 Brooksmill Dr NE
- 279 Owens Gin Rd NE
- 127 Telluride Trail NE
- 0 Owens Gin Rd NE Unit 10605970
- 0 Owens Gin Rd NE Unit 7650167
- 0 Owens Gin Rd NE Unit 10581957
- 0 Owens Gin Rd NE
- 475 Evergreen Rd NE
- 367 School House Rd NE
- 320 School House Rd NE
- 121 Harrison Ln NE
- 00 Hunts Gin Rd L2
- 1535 Hunts Gin Rd
- LOT 4 Hunts Gin Rd
- 00002 Lovebridge Rd SE
- lot 4 Lovebridge Rd SE
- 69 Southmont Dr NE
- 68 Southmont Dr NE
- 129 Southmont Dr NE
- 126 Fields Ferry Dr NE
- 147 Fields Ferry Dr NE
- 164 Fields Ferry Dr NE
- 143 Southmont Dr NE
- 114 Southmont Dr NE
- 122 Southmont Dr NE
- 125 Fields Ferry Dr NE
- 125 Fields Ferry Dr NE
- 116 Fields Ferry Dr NE
- 136 Southmont Dr NE
- 171 Fields Ferry Dr NE
- 113 Fields Ferry Dr NE
- 24 Fields Ferry Dr NE
- 64 Fields Ferry Dr NE
- 65 Fields Ferry Dr NE
- 180 Fields Ferry Dr NE
- 183 Fields Ferry Dr NE