Estimated Value: $308,362 - $334,000
3
Beds
1
Bath
1,428
Sq Ft
$225/Sq Ft
Est. Value
About This Home
This home is located at 119 Spring Rd, Adams, MA 01220 and is currently estimated at $321,591, approximately $225 per square foot. 119 Spring Rd is a home located in Berkshire County with nearby schools including Hoosac Valley Middle & High School, Berkshire Arts & Technology Charter Public School, and St. Stanislaus Kostka School.
Ownership History
Date
Name
Owned For
Owner Type
Purchase Details
Closed on
Mar 31, 2009
Sold by
Peltier Jeffrey C
Bought by
Peltier Jeffrey C
Current Estimated Value
Home Financials for this Owner
Home Financials are based on the most recent Mortgage that was taken out on this home.
Original Mortgage
$115,000
Outstanding Balance
$72,849
Interest Rate
5.14%
Mortgage Type
Purchase Money Mortgage
Estimated Equity
$248,742
Purchase Details
Closed on
Jun 1, 1999
Sold by
Delmolino Donald L and Delmolino Raye Marie
Bought by
Peltier Jeffrey C
Create a Home Valuation Report for This Property
The Home Valuation Report is an in-depth analysis detailing your home's value as well as a comparison with similar homes in the area
Home Values in the Area
Average Home Value in this Area
Purchase History
| Date | Buyer | Sale Price | Title Company |
|---|---|---|---|
| Peltier Jeffrey C | -- | -- | |
| Peltier Jeffrey C | $95,000 | -- |
Source: Public Records
Mortgage History
| Date | Status | Borrower | Loan Amount |
|---|---|---|---|
| Open | Peltier Jeffrey C | $10,000 | |
| Open | Peltier Jeffrey C | $115,000 | |
| Previous Owner | Peltier Jeffrey C | $30,000 |
Source: Public Records
Tax History Compared to Growth
Tax History
| Year | Tax Paid | Tax Assessment Tax Assessment Total Assessment is a certain percentage of the fair market value that is determined by local assessors to be the total taxable value of land and additions on the property. | Land | Improvement |
|---|---|---|---|---|
| 2025 | $4,819 | $283,300 | $78,300 | $205,000 |
| 2024 | $4,559 | $259,900 | $73,700 | $186,200 |
| 2023 | $4,274 | $230,400 | $67,200 | $163,200 |
| 2022 | $4,188 | $200,500 | $58,400 | $142,100 |
| 2021 | $25 | $182,700 | $58,400 | $124,300 |
| 2020 | $3,952 | $180,600 | $58,400 | $122,200 |
| 2019 | $19 | $180,600 | $58,400 | $122,200 |
| 2018 | $3,000 | $178,400 | $58,400 | $120,000 |
| 2017 | $3,691 | $172,700 | $58,400 | $114,300 |
| 2016 | $3,305 | $154,500 | $58,400 | $96,100 |
| 2015 | $3,257 | $152,400 | $61,000 | $91,400 |
| 2014 | $3,040 | $152,400 | $61,000 | $91,400 |
Source: Public Records
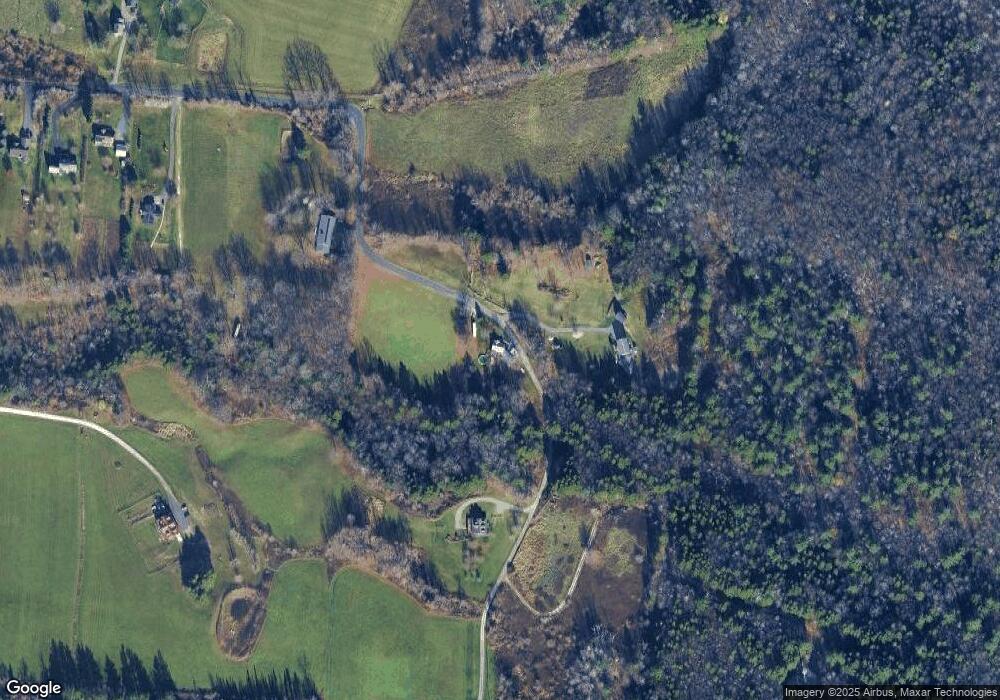
Map
Nearby Homes