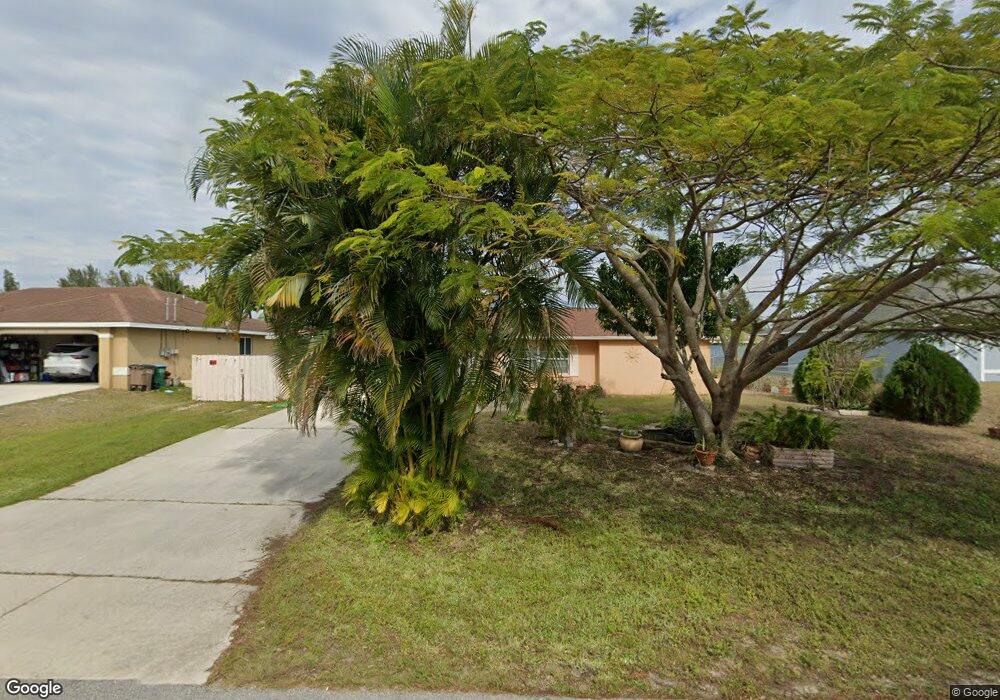
119 SW 21st Terrace Cape Coral, FL 33991
Hancock NeighborhoodEstimated Value: $270,550 - $320,000
3
Beds
2
Baths
1,493
Sq Ft
$203/Sq Ft
Est. Value
About This Home
This home is located at 119 SW 21st Terrace, Cape Coral, FL 33991 and is currently estimated at $303,138, approximately $203 per square foot. 119 SW 21st Terrace is a home located in Lee County with nearby schools including Caloosa Elementary School, Cape Elementary School, and Tropic Isles Elementary School.
Ownership History
Date
Name
Owned For
Owner Type
Purchase Details
Closed on
Sep 22, 2025
Sold by
Aguilera Guillermo
Bought by
Aguilera Reyna Izabel and Aguilera Guillermo
Current Estimated Value
Purchase Details
Closed on
Dec 1, 2003
Sold by
Fletcher Mark and Fletcher Kari
Bought by
Aguilera Guillermo
Home Financials for this Owner
Home Financials are based on the most recent Mortgage that was taken out on this home.
Original Mortgage
$125,130
Interest Rate
6.04%
Purchase Details
Closed on
Feb 14, 2003
Sold by
Jacobson Paul A and Jacobson Gail L
Bought by
Fletcher Mark and Fletcher Kari
Purchase Details
Closed on
May 17, 2000
Sold by
Liberty Savings Bank F S B
Bought by
Jacobson Paul A and Jacobson Gail I
Home Financials for this Owner
Home Financials are based on the most recent Mortgage that was taken out on this home.
Original Mortgage
$53,200
Interest Rate
8.14%
Create a Home Valuation Report for This Property
The Home Valuation Report is an in-depth analysis detailing your home's value as well as a comparison with similar homes in the area
Home Values in the Area
Average Home Value in this Area
Purchase History
| Date | Buyer | Sale Price | Title Company |
|---|---|---|---|
| Aguilera Reyna Izabel | $100 | None Listed On Document | |
| Aguilera Guillermo | $129,000 | -- | |
| Fletcher Mark | $26,000 | -- | |
| Jacobson Paul A | $68,500 | -- |
Source: Public Records
Mortgage History
| Date | Status | Borrower | Loan Amount |
|---|---|---|---|
| Previous Owner | Aguilera Guillermo | $125,130 | |
| Previous Owner | Jacobson Paul A | $53,200 |
Source: Public Records
Tax History Compared to Growth
Tax History
| Year | Tax Paid | Tax Assessment Tax Assessment Total Assessment is a certain percentage of the fair market value that is determined by local assessors to be the total taxable value of land and additions on the property. | Land | Improvement |
|---|---|---|---|---|
| 2025 | $2,367 | $80,618 | -- | -- |
| 2024 | $2,278 | $78,346 | -- | -- |
| 2023 | $2,278 | $76,064 | $0 | $0 |
| 2022 | $2,140 | $73,849 | $0 | $0 |
| 2021 | $2,103 | $155,744 | $31,221 | $124,523 |
| 2020 | $2,041 | $70,708 | $0 | $0 |
| 2019 | $2,020 | $69,118 | $0 | $0 |
| 2018 | $2,015 | $67,829 | $0 | $0 |
| 2017 | $2,000 | $66,434 | $0 | $0 |
| 2016 | $1,995 | $108,152 | $14,470 | $93,682 |
| 2015 | $1,978 | $96,491 | $11,793 | $84,698 |
| 2014 | -- | $87,902 | $8,872 | $79,030 |
| 2013 | -- | $78,903 | $7,000 | $71,903 |
Source: Public Records
Map
Nearby Homes
- 122 SW 21st St
- 118 SW 21st Terrace
- 211 SW 21st Ln
- 21 SW 21st St
- 217 SW 21st St
- 13 SW 21st St
- 31 SW 20th St
- 216 SW 20th St
- 232 SW 21st St
- 128 SW 19th Ln
- 2134 SW 2nd Ct Unit 62
- 212 SW 19th Terrace
- 2138 SW 3rd Ave
- 2135 SW 3rd Place
- 213 SW 19th Terrace
- 334 SW 21st Terrace
- 1822 SW Santa Barbara Place Unit 68
- 421 SW 21st Terrace
- 1817 SW 3rd Ave
- 149 SE 21st St
- 115 SW 21st Terrace
- 123 SW 21st Terrace
- 118 SW 21st St
- 114 Sw St
- 114 SW 21st St
- 127 SW 21st Terrace
- 111 SW 21st Terrace
- 114 SW 21st Terrace
- 126 SW 21st St
- 122 SW 21st Terrace
- 110 SW 21st St
- 131 SW 21st Terrace
- 110 SW 21st Terrace
- 126 SW 21st Terrace
- 105 SW 21st Terrace
- 130 SW 21st Terrace
- 104 SW 21st St
- 2116 SW 1st Ave
- 115 SW 21st St
- 205 SW 21st Terrace