Estimated Value: $89,000 - $105,000
4
Beds
--
Bath
960
Sq Ft
$99/Sq Ft
Est. Value
About This Home
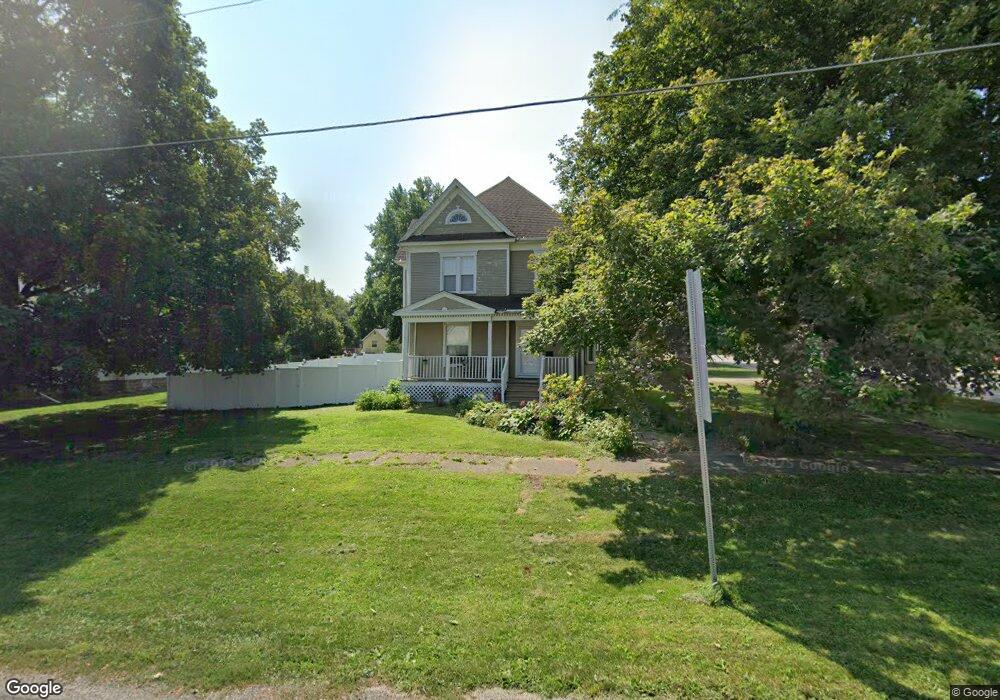
This home is located at 119 SW 3rd St, Galva, IL 61434 and is currently estimated at $95,478, approximately $99 per square foot. 119 SW 3rd St is a home located in Henry County with nearby schools including Galva Elementary School and Galva Junior/Senior High School.
Ownership History
Date
Name
Owned For
Owner Type
Purchase Details
Closed on
Dec 18, 2009
Sold by
Osborn Jacob
Bought by
Percifield Gregory S and Percifield Noriko
Current Estimated Value
Home Financials for this Owner
Home Financials are based on the most recent Mortgage that was taken out on this home.
Original Mortgage
$81,989
Outstanding Balance
$53,806
Interest Rate
5.02%
Mortgage Type
New Conventional
Estimated Equity
$41,672
Purchase Details
Closed on
Jan 21, 2006
Sold by
Kitterman Robert P and Kitterman Jody A
Bought by
Jpmorgan Chase Bank
Create a Home Valuation Report for This Property
The Home Valuation Report is an in-depth analysis detailing your home's value as well as a comparison with similar homes in the area
Home Values in the Area
Average Home Value in this Area
Purchase History
| Date | Buyer | Sale Price | Title Company |
|---|---|---|---|
| Percifield Gregory S | $82,000 | None Available | |
| Jpmorgan Chase Bank | -- | None Available |
Source: Public Records
Mortgage History
| Date | Status | Borrower | Loan Amount |
|---|---|---|---|
| Open | Percifield Gregory S | $81,989 |
Source: Public Records
Tax History Compared to Growth
Tax History
| Year | Tax Paid | Tax Assessment Tax Assessment Total Assessment is a certain percentage of the fair market value that is determined by local assessors to be the total taxable value of land and additions on the property. | Land | Improvement |
|---|---|---|---|---|
| 2024 | $1,947 | $25,659 | $2,430 | $23,229 |
| 2023 | $1,888 | $24,791 | $2,348 | $22,443 |
| 2022 | $1,656 | $22,134 | $2,096 | $20,038 |
| 2021 | $1,400 | $19,331 | $1,831 | $17,500 |
| 2020 | $1,428 | $19,511 | $1,848 | $17,663 |
| 2019 | $1,411 | $19,692 | $1,989 | $17,703 |
| 2018 | $1,360 | $19,118 | $1,931 | $17,187 |
| 2017 | $1,300 | $18,615 | $1,880 | $16,735 |
| 2016 | $1,321 | $18,523 | $1,871 | $16,652 |
| 2015 | $1,312 | $18,523 | $1,871 | $16,652 |
| 2013 | $1,312 | $18,710 | $1,890 | $16,820 |
Source: Public Records
Map
Nearby Homes